 Article in Press Printer-friendly PDF file
Westside Observer Newspaper
September 2017 at www.WestsideObserver.com
Bloat in Patronage Hiring
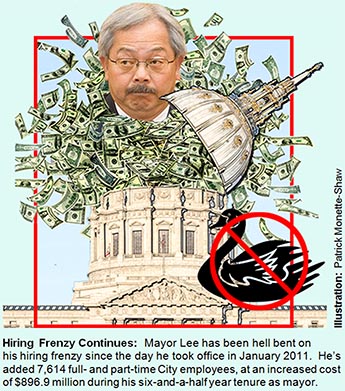
Mayor's Hiring Spree Isn't a Black Swan Event
Article in Press Printer-friendly PDF file
Westside Observer
Newspaper
September 2017 at www.WestsideObserver.com
Bloat in Patronage Hiring
Mayor's Hiring Spree Isn't a Black Swan Event
by Patrick Monette-Shaw
What follows is data1 and insights you’ll get only in the Westside Observer. You’re not going to get this level of detail from reporters Matier and Ross in the San Francisco Chronicle.
When Mayor Ed Lee was appointed to office to replace outgoing Mayor Gavin Newsom, nobody knew Lee would ratchet up the City’s budget so drastically, by how much, or how quickly.
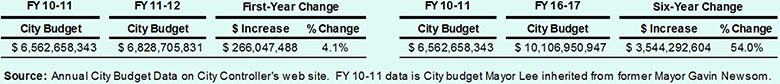
When Lee was sworn in as mayor in January 2011, he inherited Newsom’s then $6.6 billion FY 2011–2011 City budget midstream. Six months later Lee introduced his own first City budget of $6.8 billion, a modest 4.1% increase, for FY 2011–2012.
Since then, he’s been hell bent on a hiring spree.
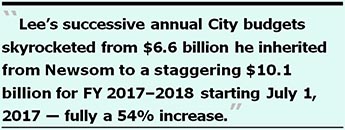 Nobody expected at the time that Lee’s successive annual City budgets would skyrocket from $6.6 billion that he inherited from Newsom to a staggering $10.1 billion budget for FY 2017–2018 starting on July 1, 2017 — a whopping $3.5 billion increase — fully a 54% increase over the City budget Lee inherited. Lee has now introduced eight City budgets, including his first.
Table 1: Total City Budgets: FY 2010–2011 to FY 2016–2017
Between March 2016 and February 2017, the Westside Observer published two articles2 on the mayor’s hiring binge. A third article written in September 2016 was published on this author’s web site in January 2017. This article is the fourth in the series, and will be updated annually.
 Which brings us back to the question: How much has Mayor Lee’s patronage hiring saga worsened?
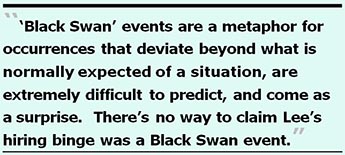
Lee’s Hiring Binge Is Not a “Black Swan” Event
Wikipedia defines “Black Swan” events as a metaphor for occurrences that deviate beyond what is normally expected of a situation, are extremely difficult to predict, and come as a surprise. Black Swan events are typically random and unexpected, and considered to be outliers. They have major effects and are often inappropriately rationalized after the fact through the benefit of hindsight, as if the events could have been expected.
But Mayor Lee’s hiring binge and the major effects it has had on the City’s overall budget was not surprising. Those effects were completely predictable, not merely random. So there’s no way to claim Lee’s hiring binge was a Black Swan
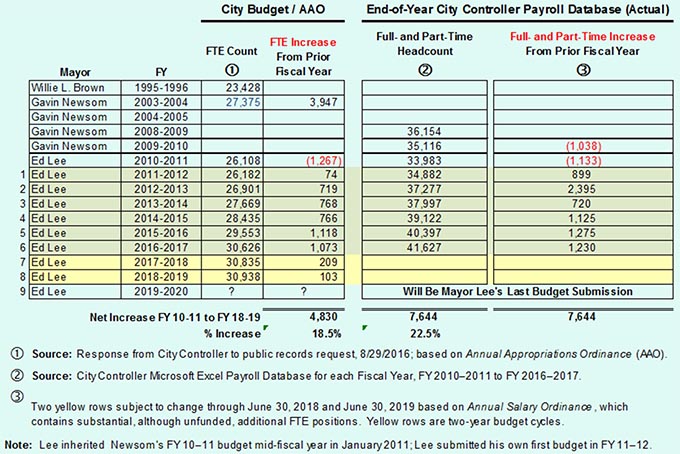
Table 2: Mayor Lee’s Payroll and Number of City Employees: FY 2010–2011 to 2016–2017
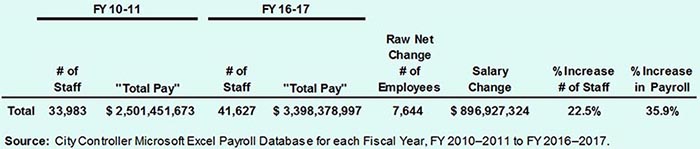
As Table 2 shows above, it’s no Black Swan accident the Mayor has added fully 7,644 full- and part-time employees since taking office, a 22.5% increase in staff and a 36% increase of $896.9 million in the total City payroll.
 4,830 FTE’s (or More) and Counting …
FTE’s — “full-time equivalent” employees — are calculated by combining multiple part-time employees into an equivalent 1.0 full-time employee. An FTE of 1.0 is equivalent to a full-time worker, while an FTE of 0.5 is a half-time worker. An alternate way of calculating the number of FTE’s is take the total number of hours worked in an organization annually divided by the typical 2,080 hours in a full-time schedule (40 hours per week times 52 weeks).
 Each year, San Francisco’s city government sets its authorized FTE level of city employees by adopting both an AAO (Annual Appropriation Ordinance, also known as the City’s official budget), and an ASO (Annual Salary Ordinance), the latter of which typically sets the number of FTE’s much higher than the authorized and funded FTE’s in the City budget. The FTE’s set in the ASO are not funded positions, but they are available should the City adopt a budget supplemental to fund the additional positions.
All too often, the number of FTE’s reported in the City Controller’s payroll database exceed the FTE’s budgeted in the AAO. And Mayor Lee’s voracious appetite for hiring has lead to a massive bloat swelling the City’s budget.
A third method to calculate the number of FTE’s is to utilize the City Controller’s payroll database that lists all full- and part-time employees in each fiscal year.
 In the first article, “Mayor’s Hiring Binge vs. Retire Pensions” published in March 2016, the Observer reported that between the budget he had inherited from Newsom in FY 2010–2011 and FY 2014–2015, the Mayor had added 5,139 additional full- and part-time employees, a 15.1% change increase. Two years later, the Controller’s payroll database shows Lee has added an additional 2,505 full- and part-time employees in just the past two fiscal years, bringing the total of new hires to 7,644, and pushing the total number of employees on the City payroll to 41,627. That now represents a 22.5% change increase since Lee was appointed as mayor when there were just 33,983 employees on the payroll.
The number of actual full- and part-time employees on the City’s payroll stands in sharp contrast to the headcounts in the AAO authorized for each fiscal year. There are fully 11,001 more full- and part-time employees (at 41,627) than the authorized FTE headcount of 30,626 in the AAO authorized for FY 2016–2017 that just ended on June 30, 2017, shown in Table 3 below.
Table 3: FTE Counts Across Fiscal Years
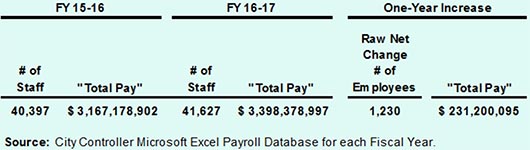
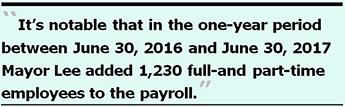 It’s notable that in the one-year period between FY 2015–2016 (that ended June 30, 2016) and FY 2016–2017 (that ended June 30, 2017), Mayor Lee added 1,230 full-and part-time employees to the payroll. The $231.2 million increase in total pay during that one-year period shown in Table 4 below represents fully 25.8% of the total $896.9 million payroll increase since he took office in January 2011 (shown in Table 2 above).
Table 4: One-Year Increase in FTE Counts: FY 2015–2016 to FY 2016–2017
Glaring Discrepancy in FTE Counts Between AAO and City Controller’s Payroll Database
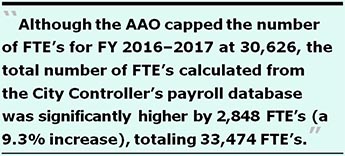 The adopted AAO for FY 2016–2017 showed a budgeted 30,626 FTE’s for the fiscal year. The City Controller’s payroll database shows the “computed” FTE’s for the same fiscal year to be significantly higher.
Again, the very definition of a 1.0 FTE is someone presumed to work 40-hour weeks for 52 weeks each year, or a total of 2,080 hours.
Table 5 illustrates that although the AAO had capped the number of FTE’s for FY 2016–2017 at 30,626, the total number of FTE’s calculated from the City Controller’s payroll database was significantly higher by 2,848 FTE’s (a 9.3% increase), totaling 33,474 FTE’s when overtime and additional “regular hours” are factored in.
Table 5: Excess FTE’s Beyond AAO Authorization
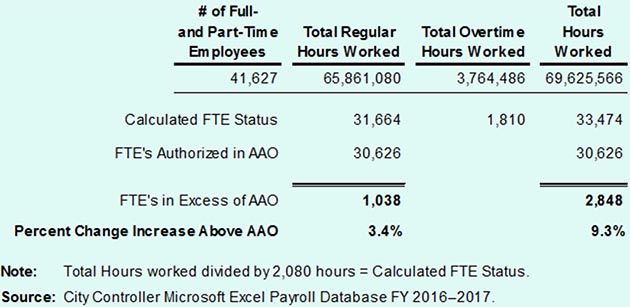
 What this means is that San Francisco taxpayers were told the City needs 30,626 FTE’s to conduct the City’s business, but it actually has 33,474 FTE’s.
Growth in the “$100,000 Club” Is Also No “Black Swan” Event
When it comes to the obscene increase in the number of City employees earning over $100,000 annually under Mayor Lee, reasonable people may hope the famous line in Shakespeare’s play Romeo and Juliet “A rose by any other name would smell as sweet” might hold true for Lee’s hiring record.
 Unfortunately the increase in the number of employees earning over $100,000 annually under Mayor Lee doesn’t smell “sweet,” it stinks to high heaven, reminiscent of unharvested cabbage rotting in the fields in scorching heat at the end of summer in the countryside where I grew up.
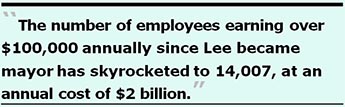
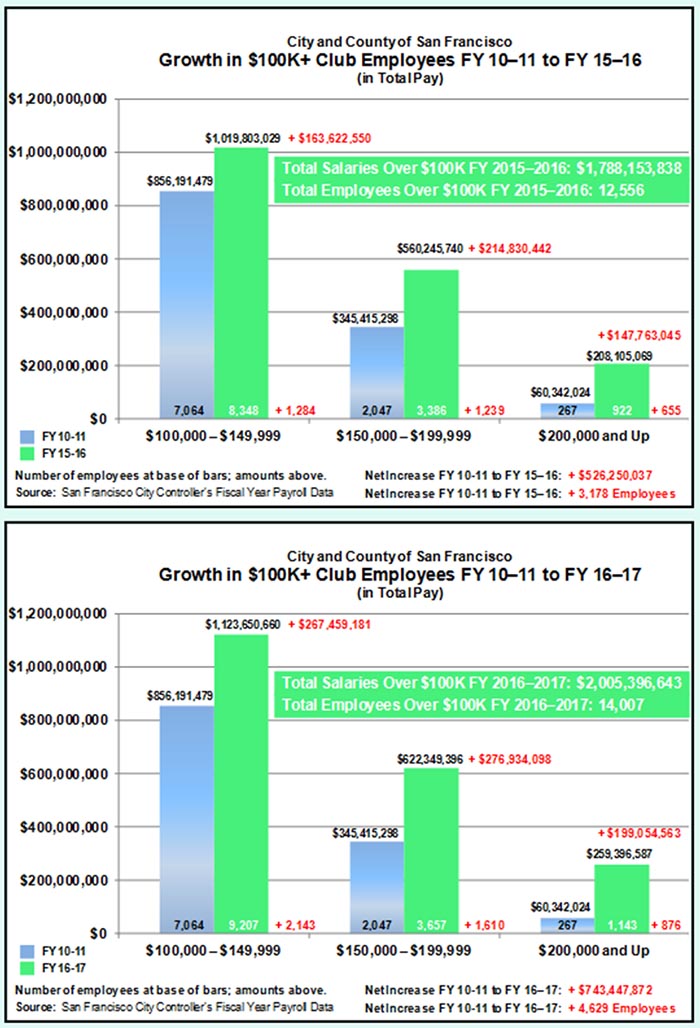
Figure 1 illustrates that the number of employees earning over $100,000 annually since Lee became mayor has skyrocketed to 14,007 at an annual cost of $2 billion, a net increase of three-quarters of a billion dollars since he took office. The Controller’s payroll database for FY 2016-2017 totaled $3.4 billion (more accurately $3,398,378,997).
Figure 1: The Growth in the “Over-$100K Club” Keeps Soaring — FY 2010–2011 to FY 2016–2017
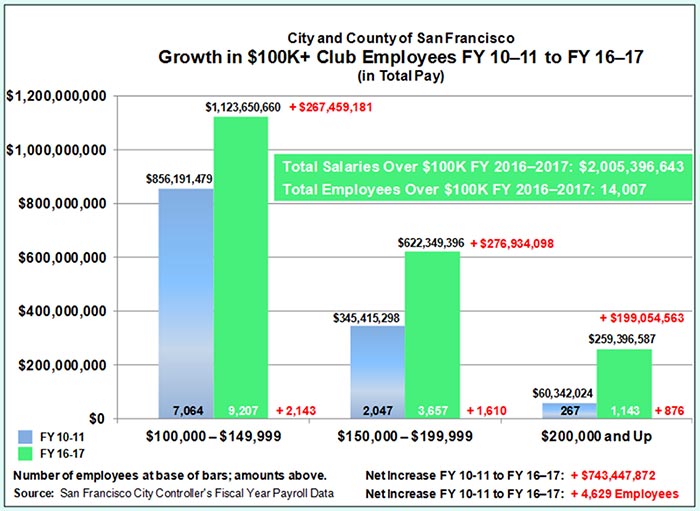
[Editor’s Note: Figure 1 is repeated at the end of this article showing graphically the difference between the data for the fiscal year that ended June 30, 2016 vs. June 30, 2017 as a visual aide.]
The Controller’s payroll database shows that for the fiscal year ending June 30, 2017 the now 14,007 employees who earn over $100,000 annually in total pay represent just one-third (33.6%) of the City’s 41,627 full- and part-time employees, and hog 59% (fully $2 billion) of the entire City payroll. That leaves the other 27,620 (66.4%, or two-thirds) City employees who earn less than $100,000 annually to fight among themselves for the remaining $1.4 billion of the payroll.
Figure 1 is presented in tabular format in Table 6 below to show the percent increases in staff and dollar amounts for two time periods: The full six-year tenure of Mayor Lee through FY 16–17, and the one-year change from June 30, 2016 to June 30, 2017.
Table 6: Percent Change Increases in the “$100,000 Salary Club”
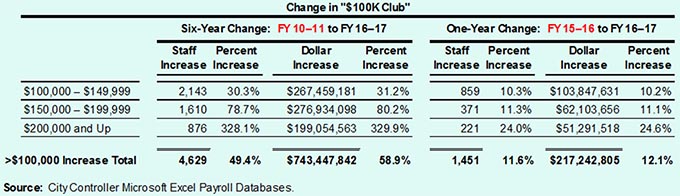
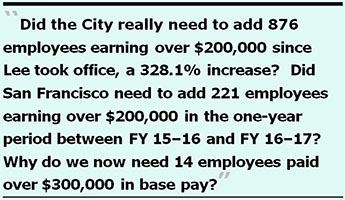 Did the City really need to add 876 employees earning over $200,000 since Lee took office, a 328.1% increase? For that matter, did San Francisco really need to add 221 employees earning over $200,000 in the one-year period between FY 15–16 and FY 16–17? Or is this all about patronage jobs?
When Lee took office in 2011, there were just two City employees paid more than $300,000 in base (regular) pay for a combined total of just $642,358. As of the end of June 2017, we now have 14 employees paid over $300,000 in base pay, which now costs us $4.93 million annually.
What Else Is Wrong With This Employment Picture?
Table 7 illustrates that of the 7,644 employee increase between FY 10–11 and FY 16–17, fully 60.6% (4,629) involve employees paid more than $100,000 annually in total pay, who consumed 83% ($743.4 million) of the $896.9 million increase in the total salaries since FY 10–11. By contrast, employees paid less than $100,000 annually represented 39.4% (3,015) of the additional hires, but received just 17% ($153.5 million) of total payroll increase since FY 10–11.
Table 7: Percent Change Increases in the $100,000 Salary Club
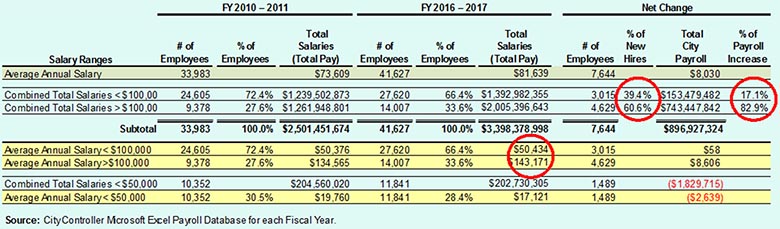
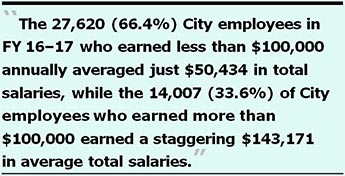
Table 7 also shows the vast disparity in average annual salaries. The 27,620 (66.4%) of City employees in FY 16–17 who earned less than $100,000 annually averaged just $50,434 in total salaries, while the 14,007 (33.6%) of City employees who earned more than $100,000 had a staggering $143,171 in average total salaries. The inequities in average annual salaries for the 33.6% of employees at the top of the City’s food chain is nothing short of remarkable.
 There are additional inequities between the full- and part-time statuses for employees earning less than, or more than, $100,000 annually, as shown in Table 8.
Between FY 10–11 and FY 16–17 for those who earn less than $100,000 annually, there has been:
In stark contrast, during the same period, for those who earn more than $100,000, there has been:
Table 8: Contrasting Employment Status by Annual Salaries
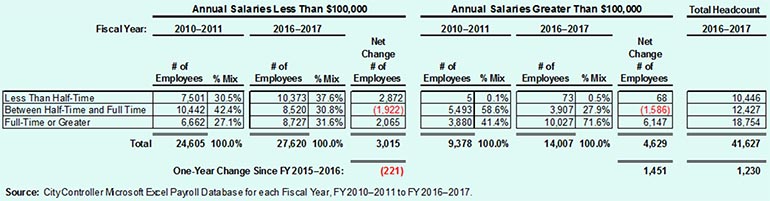
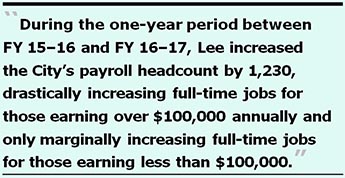
What this suggests is that the City is disproportionately hiring more full-time employees who earn over $100,000 annually than it is hiring full-time employees earning less than $100,000. And it suggests that during just the one-year period between FY 15–16 and FY 16–17, Lee increased the City’s payroll headcount by 1,230, drastically increasing full-time jobs for those earning over $100,000 annually and only marginally increasing full-time jobs for those earning less than $100,000.
 This can’t possibly be that those earning less than $100,000 magically received pay raises pushing them over the $100,000 threshold; it more likely suggests Lee is simply hiring higher-paid employees at the expense of hiring lower-paid employees.
Growth in City Managers
Not all of the managerial jobs in the City are captured in the data below, since many job classification codes do not reveal that the positions are actually senior managers. But for a snapshot, there’s a range of job classification codes that are easily obtainable.
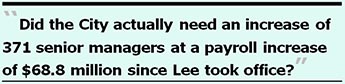
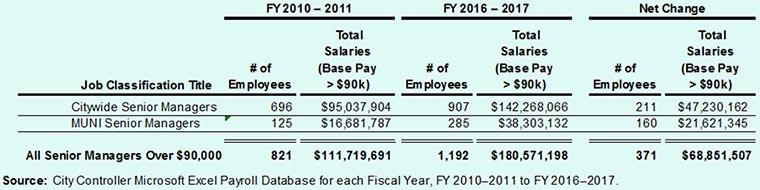
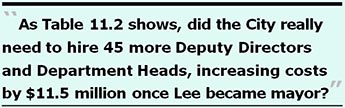
Table 9 shows the growth in senior managers for a good portion of the City’s managers. One reasonable question is whether the City actually needed an increase of 371 senior managers at a combined payroll increase of $68.8 million since Lee took office.
 While it is true these additional 371 employees represent just 4.9% of the total 7,644 full- and part-time employees Lee has added during his tenure, the $68.6 million increase in senior manager salaries represents 7.7% of the $896.9 million increase to the total payroll since FY 2011–2012.
Table 9: Growth in Senior Managers: FY 2010–2011 to FY 2016–2017
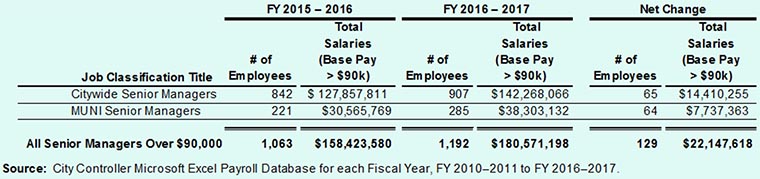
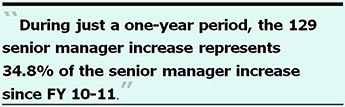 Of the 371 senior manager’s increase since FY 10–11 shown in Table 9, 129 of them have been added at a combined cost of $22.1 million (of the $68.8 million increase) during just a one-year period between FY 15–16 and FY 16–17, shown in Table 10. In other words, during just a one-year period, the increase of 129 senior managers represents 34.8% of the senior manager increase since FY 10-11, and 32.2% of the increased total salaries since FY 10-11.
Table 10: One-Year Increase in Senior Managers: FY 2015–2016 to FY 2016–2017
Details of the senior manager bloat since FY 11–12 are provided in the following two tables.
Table 11.1: Growth in Senior Managers — MUNI Only
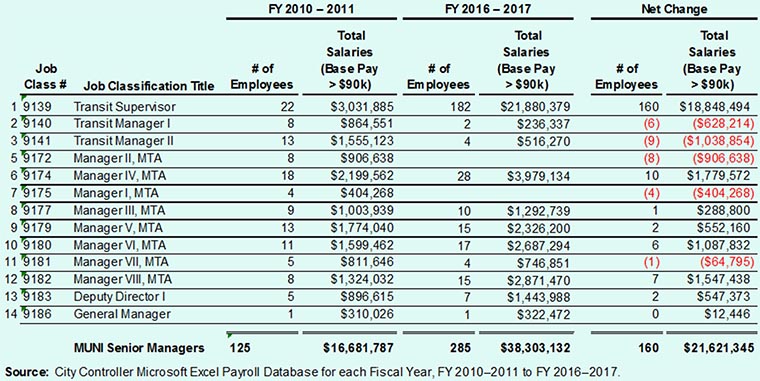
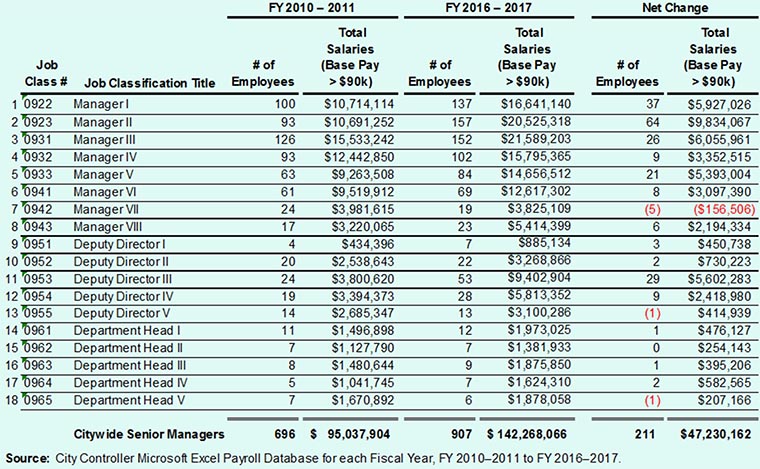
Table 11.2: Growth in Citywide Senior Managers (Excluding MUNI)
 Growth in City Department Staffing
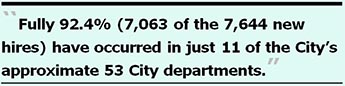
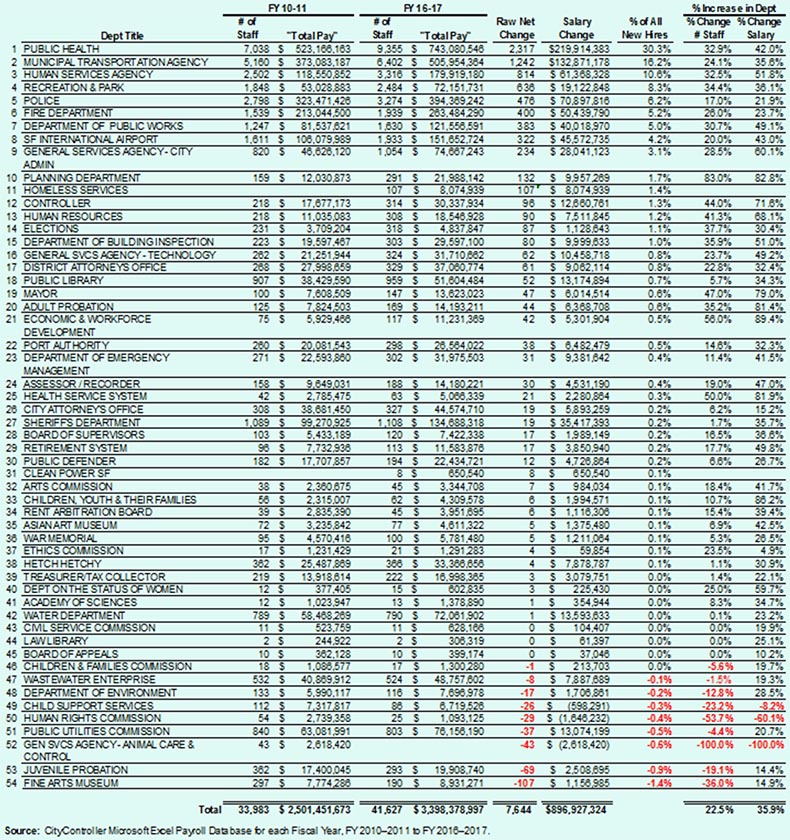
As Table 12 below illustrates, of the 7,644 additional full- and part-time employees Mayor Lee has added to the City payroll since he was appointed as mayor in January 2011, fully 92.4% (7,063 of the new hires) have occurred in just 11 of the City’s approximate 53 City departments.
Nearly one-third of the growth in total employees in the City Controller’s payroll database occurred in the Department of Public Health. Observers have long worried that the growth at the Health Department is all but unsustainable., and they are right to worry so.
 The claim that Police Department and Fire Department have been shortchanged, is simply unsupportable, given both departments have added over 400 employees each.
Table 12: Growth by Top 11 City Department’s
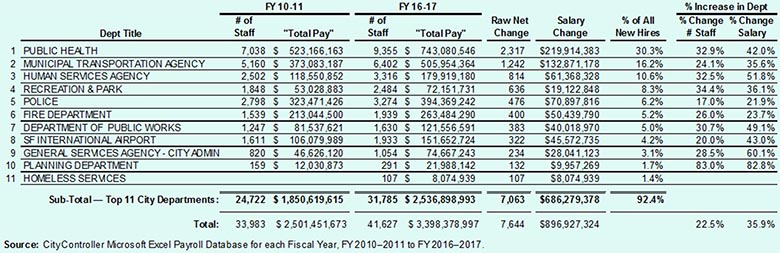
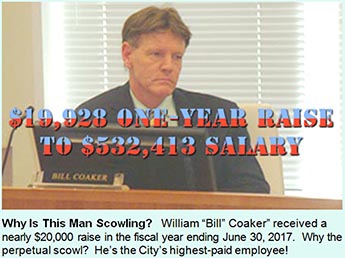 Table 12 is an extract; the full list of the growth by City Departments is shown in Addendum 1 at the end of this article.
Highest Paid City Employees and Other Concerns
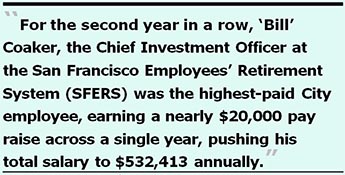
For the second year in a row, “Bill” Coaker, the Chief Investment Officer at the San Francisco Employees’ Retirement System (SFERS) was the highest-paid City employee, earning a nearly $20,000 pay raise across a single year, pushing his total salary to $532,413 annually. What he accomplished in the way of goals, or increasing the overall valuation of the $21 billion pension system, is not known.
As Table 13 below shows, three of the City’s 14 highest-paid employees are employees of SFERS.
Of interest, Art Wang — now the City’s third-highest-paid employee — was promoted to being a managing director at SFERS at some point during FY 2015–2016, but his pay raise of $160,413 to $418,777 didn’t catch up to him until the following fiscal year, for some unknown reason. For his part, SFERS’ David Francl — hired during FY 2015–2016 to oversee SFERS’ hedge funds investments— is now the eighth-highest-paid City employee.
 Four of the 14 highest-paid employees are employees in the Department of Public Health.
Table 13: San Francisco’s Top 14 Salary Earners, FY 2016–2017
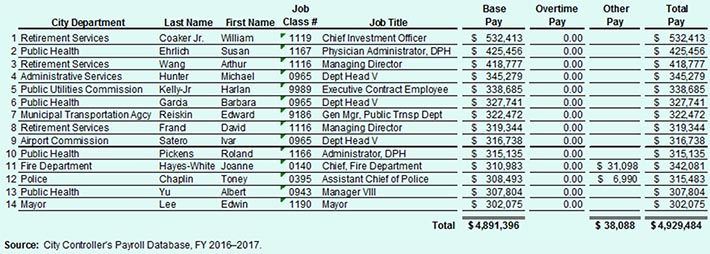
There were 14 City employees who worked more than 3,120 hours in “regular time” alone during FY 2016–2017, indicating they racked up 60 hours (or more) per week as “regular time.” All 14 were officers in the Police Department.
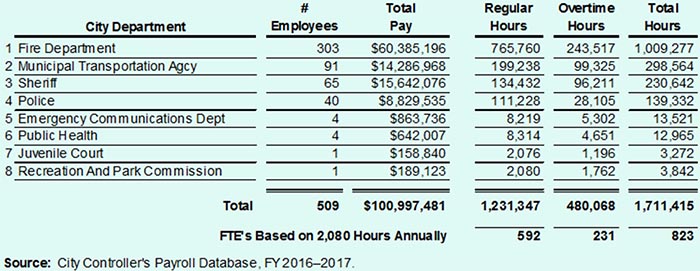
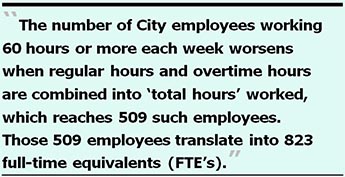
 The number of City employees working 60 hours or more each week worsens when regular hours and overtime hours are combined into “total hours” worked, which reaches 509 such employees shown in Table 14 below.
Those 509 employees translate into 823 full-time equivalents (FTE’s), at $100.1 million of the City’s payroll. There were 18 employees who racked up over 4,000 “total hours” each, indicating they worked close to two full-time jobs apiece.
Table 14: Employees Working Over Time-and-a-Half (3,120 Hours or More)
The 303 Fire Department firefighters who worked 60 or more hours per week (greater than 3,120 hours annually as a 1.5 FTE) represent just 16.4% of the Fire Department’s 1,845 firefighters, paramedics, and paramedics/firefighters. It’s a pretty exclusive club of those who rack up 60 hours per week.
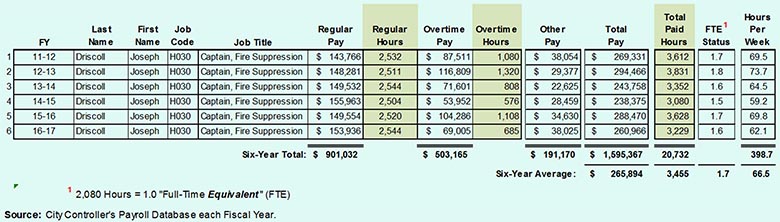
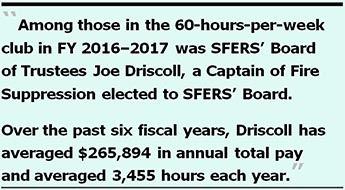
 Among those in the 60-hours-per-week club in FY 2016–2017 was SFERS’ Board of Trustees, Joe Driscoll, a Fire Department Captain of Fire Suppression who is also an active-duty firefighter elected to SFERS’ Board.
Over the past six fiscal years, Driscoll has averaged $265,894 in annual total pay (including regular pay, overtime pay, and so-called “other pay”), has averaged 3,455 total hours each year (including regular hours and overtime hours), and has averaged being a 1.7 FTE across those six years — averaging 66.5 hours each week in each of the six years.
Table 15: Joe Driscoll’s FTE Status, FY 2011–2012 Through FY 2016–2017
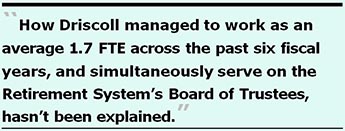
 How Driscoll managed to work as an average 1.7 FTE across the past six fiscal years, and simultaneously serve as a Trustee on the Retirement System’s Board of Directors and attend multiple SFERS full-Board and other subcommittee meetings each month, hasn’t been explained.
As for the 1,845 firefighters, 1,542 (83.6%) worked less than 60 hours weekly, 882 (47.8%) worked less than 50 hours weekly, 575 (31.2%) worked less than 45 hours weekly, and 333 (18%) worked 40 hours or less weekly. It’s clear that the 303 firefighters (16.4%) who worked more than 60 hours weekly represent a minority of Fire Department staff.
Where’s the Beef (err, the Auditors)?
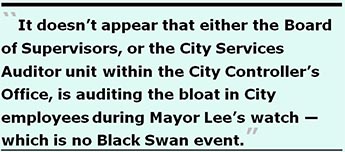
 As the Westside Observer reported in “Who’s Auditing Mayor’s Hiring Binge” in February 2017, it doesn’t appear that either the Board of Supervisors, or the City Services Auditor unit within the City Controller’s Office, is auditing — or is even interested in auditing — this bloat of growing the number of City employees during Ed Lee’s watch as mayor. Taxpayers deserve an explanation why Lee’s hiring binge hasn’t been audited, or when the hiring might stop.
If it walks like a duck, quacks like a duck, and smells like a duck, then it’s probably Mayor Lee on a hiring binge. But it’s most certainly not a Black Swan.
 San Francisco’s next election for mayor will be held in November 2019. Lee will have served for eight-and-a-half years at that point. You can expect that during the next two years, Lee will continue his hiring binge as a lame duck, perhaps while singing his swan song.
Monette-Shaw is a columnist for San Francisco’s Westside Observer newspaper, and a member of the California First Amendment Coalition (FAC) and the ACLU. He operates stopLHHdownsize.com. Contact him at monette-shaw@westsideobserver.com.
_______________
1 Data presented in this article is based on the City Controller’s annual payroll databases in Microsoft Excel spreadsheets for each year between FY 10–11 and FY 16–17 (that ended on June 30, 2017). This author imports the Excel files into a Microsoft Access database to facilitate data analysis. It is thought Matier and Ross only perform a cursory examination of the data in the Excel files each year, and reporting by other Chronicle reporters rarely analyze the data in any depth.
2 The two articles previously published in the Westside Observer are: “Mayor’s Hiring Binge vs. Retiree Pensions,” (March 2016); and “Who’s Auditing Mayor’s Hiring Binge?,” (February 2017). A third article, “Mayor’s Five-and-a-Half Year Hiring Binge,” (September 2016) was published on this author’s web site in January 2017.
Addendum 1
This is the full list of increases in the City payroll by City Department that was excerpted as Table 12 of this article.
It’s worth repeating: As Table 12 illustrates, of the 7,644 additional full- and part-time employees Mayor Lee has added to the City payroll since he was appointed as mayor in January 2011, fully 92.4% (7,063 of the new hires) have occurred in just 11 of the City’s approximate 53 City departments.
Addendum 2
As a point of reference, Figure 1 on page 4 of this article is repeated here, showing the same data points for the period ending June 30, 2016 cotrasted to the period ending June 30, 2017. The shift in the bars in the chart are alarming.
Bear in mind that Mayor Lee’s hiring binge won’t be over until he is termed out of office in January 2020, and there will be three more City budgets — and concomittant increases to FTE’s and total full- and part-time employees — before he is terminated as mayor.