 Article in Press Printer-friendly PDF file
Westside Observer Newspaper
February 2017 at www.WestsideObserver.com
5,090 and Counting": Bloat Under Ed Lee
Who's Auditing Mayor's Hiring Binge?
Article in Press Printer-friendly PDF file
Westside Observer
Newspaper
February 2017 at www.WestsideObserver.com
5,090 and Counting": Bloat Under Ed Lee
Who's Auditing Mayor's Hiring Binge?
by Patrick Monette-Shaw
February 10, 2017 Update:
New Hires FY 2010–2011 to FY 2015–2016 — by Department
New Hires FY 2010–2011 to FY 2015–2016 — % Mix of New Hires
I won’t keep you in suspense. The answer to the rhetorical question in the title of this article is — wait for it — nobody!
Theoretically, the legislative branch of City Hall — the Board of Supervisors — should have been providing some sort of checks and balances to the Mayor’s hiring binge. That didn’t happen.
In August 2016, San Francisco Chronicle reporter Heather Knight reported that when he asked about the size of City government and salaries paid to City employees, Supervisor Scott Wiener had said at the time:
“… he wouldn’t defend every single hire made in the last five years and that he knows 30,626 workers
[‘Full-Time equivalents’] sounds like an awful lot.”
 If the Legislative Branch won’t defend every single hire Mayor Lee has made during his tenure, it’s reasonable to conclude the full Board of Supervisors has provided no checks or balances to the patronage hiring binge occurring under taxpayer’s noses.
Along the way, that makes not only former-Supervisor Scott Wiener partly responsible for the hiring binge, so, too, are every member of the Board of Supervisors who voted year in and year out to pass Mayor Lee’s annual City budgets by incrementally adding new hires, when they should have been questioning the need for each and every new full- or part-time employee added to the City’s payroll. They didn’t. That also didn’t happen.
 When it comes to following Mayor Ed Lee’s patronage hiring binge, you might as well be following a bouncing ball.
Mayor’s Bloat of City Government Employees
On August 29, 2016 the City Controller provided historical data showing the number of FTE’s added across various fiscal year City budgets. (FTES’ are “full-time equivalent employees” calculated by combining multiple part-time employees into an equivalent 1.0 full-time employee.) The data is sobering, since it indicates the number of FTE’s may have soared somewhere between 18.4% and 30.2% during Mayor Lee’s watch.
 Table 1: FTE Counts Across Fiscal Years and Calendar Years
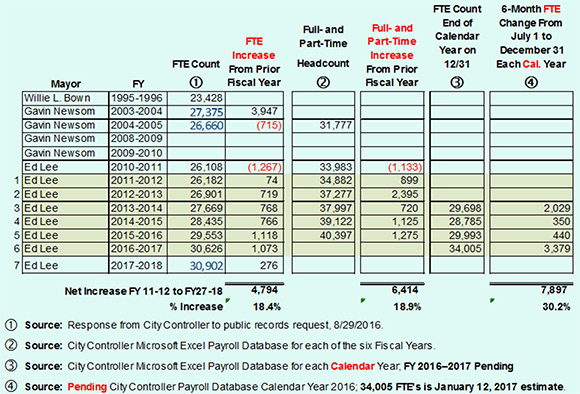
 As data in Table 1 shows, the City had 30,626 FTE’s budgeted at the start of FY 2016–2017 on July 1, 2016. If preliminary data from the Controller’s Office provided on January 12, 2017 holds true, by the end of Calendar Year 2016 on December 31, 2016 the number of FTE’s may have jumped by 3,379, to 34,005. If that pans out, the Mayor appears to have possibly added 7,897 FTE’s — and an as-yet unknown number of actual full- and part-time employees that at last count stood at 40,397 employees — during his now six-year tenure as mayor, a 30.2% net increase in total FTE’s since taking office. The data will be confirmed in July 2017.
 Back in March 2016, I wrote on article on Mayor Ed Lee’s hiring binge vs. City retiree pensions (“Mayor’s Hiring Binge vs. Retiree Pensions,” available on my web site in a printer-friendly PDF file. That first article focused on the City’s FY 2014–2015 budget that ended June 30, 2015.
That first article noted the City Controller’s Office admitted that as of December 2015 of $42 million in increased City employer share of pension contributions projected for the FY 2016–2017 that started on July 1, 2016, fully $14 million of the $42 million — 33.3% — was attributable to increased pension costs as a direct result of adding additional new City employees when the FY 2016–2017 budget had first been adopted (as part of the then two-year budget planning cycle) in July 2015.
I wrote a follow-up article (“Mayor Lee’s Five-and-a-Half Year Hiring Binge”) on September 5, 2016 (but didn’t post it on-line until January 14, 2017), that turned to examining the City’s FY 2015–2016 budget ending June 30, 2016. The follow-up article illustrates that in the five-and-a-half years since Lee took office in the middle of FY 2010–2011, he added a total of 4,794 “Full-Time Equivalents,” or FTE’s (defined as multiple part-time employees converted to an equivalent 1.0 full-time employee), which translates into having added a total of 6,414 full- and part-time City employees to the City payroll during his tenure.
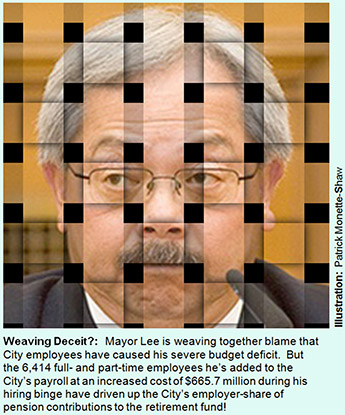
 As a result, since Lee took office the City’s payroll has increased by $665.7 million annually, from $2.5 billion in FY 2010–2011, to $3.2 billion in FY 2015–2016 ending June 30, 2016. And that’s excluding the increased employer-share of contributions to the City’s pension system and additional fringe benefits, including health insurance expenses!
Starting July 1, 2016, the City reportedly had fully 30,626 FTE’s, or fully 40,397 full- and part-time employees, on the City’s payroll. But it is thought the number of FTE’s may have skyrocketed between July 1 and December 31, 2016.
By contrast, former Mayor Willie Brown had added just 3,947 FTE’s during his eight-year tenure compared to Mayor Lee’s nearly 4,784 additional FTE’s over a five-and-a-half year period. Clearly Mayor Lee’s hiring binge is nowhere near over, because he still has two fiscal years left before being termed out.
 One unanswered question is why San Francisco needed to add 655 more employees earning over $200,000 annually, each, at an increased cost of $147.8 million during Ed Lee’s tenure. The $147.8 million increase for the additional employees earning over $200,000 was fully 22.2% of the $665.7 million in payroll growth!
Why did the City need 922 employees earning over $200,000 each, at a total cost of $208.1 million? For that matter, of the 6,414 additional full- and part-time employees Lee added since taking office 3,178 (49.5) earn over $100,000 annually and they account for 79% ($525.2) million of the $665.7 million annual payroll increase. The remaining 51.5% (3,236) split the $139.5 million payroll increase. Those employees earning over $100,000 are going to drive up costs to the City’s pension systemfor decades to come!
San Franciscans deserve a top-to-bottom audit of the 6,414 additional full- and part-time employees Mayor Lee has added to the payroll (through June 30, 2016) since taking office, and during his hiring spree. How many more full- and part-time employees has he added between July 1, 2016 and today’s date? If he did add 3,379 additional FTE’s between July 1 and December 31, 2016 how many additional full- and part-time employees does that translate to above the 6,414? What impact will that have on the City’s pension system?
 Heather Knight whined on August 27, 2016 in the San Francisco Chronicle about “average” City salaries, falsely asserting “San Francisco workers” average salaries stood at $108,774. That’s poppycock! Knight didn’t clarify whether that was for public-sector versus private-sector employees, or whether she was referring to average salaries of only City employees. Perhaps one editor or another in Knight’s food chain confounded the matter, mixing up whether she was referring to only City employees, or to private sector employees in San Francisco.
As of June 30, 2016, fully 69% — 27,841 — of all City employees earned less than $100,000 annually, and averaged just $49,532 in annual salaries, not $108,774. And indeed, of the City’s 40,397 City employees as of June 30, 2016, fully 12,296 — 30.4% — earned less than $50,000 annually and averaged just $17,771 in average salaries. Wage disparity and wage inequity has never been greater in San Francisco City employee history than under Ed Lee.
 My September 5, 2016 update to the Mayor’s hiring binge introduced you to your new highest-paid City employee. That’s the Chief Investment Officer at the San Francisco Employees’ Retirement System (SFERS), William J. Coaker, Jr., who earned a whopping $512,485 in base pay for the period ending June 30, 2016.
Assuming Coaker received a 3% raise — $15,375 — starting on July 1, 2016 he may now be earning $527,860 annually. And if he gets another 3% raise — $15,816 — come July 1, 2017 he’ll be up to a staggering $543,695 annual salary, before any fringe benefits and his own pension benefits from the City. That’s absent any proof that he has materially increased the value of the Pension Fund’s portfolio, and absent proof he has been able to lessen the amount of General Fund expenditures to lower the taxpayer’s employer-share of contributions to support the Pension fund.
Knight mentioned not one word about Coaker’s obscene half-million-dollar salary!
 The Bouncing “FTE” Ball
Following the FTE bouncing ball of the number of FTE’s lee has added is more difficult than it appears. Course corrections typically come from the bottom up. If there will ever be a course correction to the Mayor’s bloated FTE hiring binge, the time for doing so is now.
Although I wrote in September that based on records provided by the City Controller’s Office the Mayor had added 4,794 FTE’s since taking office in 2010–2011, the San Francisco Examiner reported on December 14 that the number of FTE’s Lee has added stood at 5,090. That’s a sudden increase of 296 additional FTE’s. The Examiner reported the Mayor has ordered City departments to “stop growing.”
 The Examiner appears to have been referring to a PowerPoint presentation made by the Mayor’s Office of Public Policy and Finance on December 14, 2016 that the City has added 5,090 FTE’s since FY 2011–2012. The 296 difference between the Controller’s data and data from the Office of Public Policy is a significant number of additional FTE’s.
So which is the accurate number of additional FTE’s added by the Mayor since FY 2010–2011? 4,794? 5,090? Or a new number of potentially 7,897 additional FTE’s?
On September 15, 2016, the City Controller’s Office notified this author that the City’s annual budget for FY 2016–2017 included authorization for 30,626 FTE positions (as noted in the Annual Appropriation Ordinance, or AAO).
 But on January 17, 2017, the Controller’s Office indicated that the actual number of FTE’s over the course of a given time period — or at a particular point in time — may be higher than the actual budgeted number, due to part-time workers or departures, and new hires over the course of a year. The fiscal year 2016-2017 Annual Salary Ordinance (ASO) authorizes FTE positions, including capital positions. But the Controller noted that some positions may be not entirely funded and the data may not account for attrition. The Controller lamely noted that at any given time, the City’s FTE’s “will likely fall within the range of the authorized positions [between] the AAO and ASO.”
 Are we to believe that it was the 30,626 FTE’s in the FY 2016–2017 adopted City budget (the AAO), or the 36,216 FTE positions authorized in the ASO?
Or are we to believe that it is the preliminary 34,005 FTE’s at the end of Calendar Year 2016 the Controller reported on January 12, shown in Table 1 above? Hard telling what the actual number is!
I asked the City Controller on January 2, 2017 for clarification of the number of FTE’s on the City’s payroll on December 30, 2016. The Controller’s staff lamely responded on January 12 that there were 34,005 “paid staff.” Despite repeated follow-up requests, the Controller has still not confirmed whether “paid staff” and “FTE’s” are synonymous terms, or the ending count of FTE’s on December 30.
The Controller went on to say on January 17:
“Given these authorized numbers are for the fiscal year, the number provided to you previously [on January 12, 2017], of 34,005 paid staff, provides a snapshot in time accounting of City employees being paid as of the date you requested [January 2, 2017]. After the calendar year 2016 data becomes available, we can provide additional details on payments made to all employees during the calendar year.”
 Other questions include: Did the City increase the number of FTE’s from 30,626 at the end of June 2016 to potentially 34,005 FTE’s six months later at the end of December 2016? Is there a likelihood that the number of FTE’s has actually climbed to 36,216 in the ASO? That’s a significant increase of between 3,379 and 5,590 additional FTE’s in just six months — probably more than the 5,090 FTE’s the Examiner reported on December 14 that the Mayor has added since taking office mid-year in FY 2010–2011!
This also bears repeating asking: If the 3,379 additional FTE’s proves to be accurate, the Mayor may have added at least 7,897 FTE’s — a sobering 30.2% increase — during his tenure? Is this a patronage hiring binge driven by a drunken sailor, or what?
Mayor’s Lip Service Limiting Size of City Government
So far, the Mayor has paid mere lip service to limit the size of City government employees. His efforts appear to have been pathetic.
 As I wrote in my election recommendations last October, if the Mayor’s November 2016 proposed sales tax ballot measure failed the City’s current year budget would instantly become “unbalanced,” with the City facing a huge hole of $37.5 million in the City’s current budget through June 30, 2017, and another $155.1 million hole in next fiscal year’s budget for FY 2017–2018 starting July 1, 2017 — for a total of $188.5 million.
Sometimes, strange things happen, like when that sales tax ballot measure did end up being rejected by voters — throwing the City’s two-year planned budget into complete chaos by reducing “anticipated City revenues.” The Mayor hasn’t indicated how he’ll fix the $37.5 million hole in the current fiscal year budget, beyond platitudes.
 Mayor's Skimpy Rebalancing Plan
Mayor Lee submitted a skimpy Rebalancing Plan four-page memo to Board president London Breed, Supervisor Mark Farrell as the immediate-past Chair of the Budget and Finance Committee, and City Controller Ben Rosenfield on December 8, 2016 that notes he has “cancelled” budget set-asides for homelessness services and transportation included in his so-called “balanced budget” he proposed on June 1, 2016.
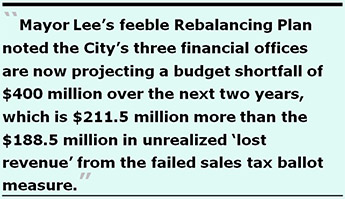
Mayor Lee’s feeble Rebalancing Plan noted the City’s three financial offices are now projecting a budget shortfall of $400 million over the next two years, which is $211.5 million more than the $188.5 million in unrealized “lost revenue” from the failed sales tax ballot measure.
The Rebalancing Plan memo lamely noted the Mayor would release “budget instructions” to [City] Department Heads also on December 8, in which he would “ask them to reduce General Fund support by 3% in each of the two upcoming budget years (resulting in a cumulative 6% reduction in the second year of the budget).” The Mayor was referring to FY 2017–2018 to start in July 2017 and the subsequent FY 2018–2019 budget that would end in June 2019.
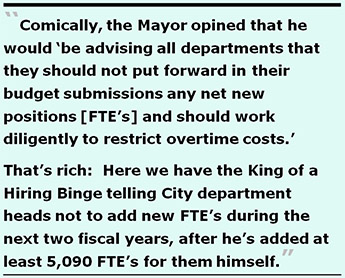
 Comically, the Mayor opined that he would “be advising all departments that they should not put forward in their budget submissions any net new positions [FTE’s] and should work diligently to restrict overtime costs.” That’s rich: Here we have the King of a Hiring Binge telling City department heads not to add new FTE’s during the next two fiscal years, after he’s added at least 5,090 FTE’s for them himself — and perhaps more — with the stroke of his Mayoral pen.
Weak Dog-and-Pony Show: Department Budget Instructions
 Next, Mayor Lee followed up with his December 13 “Budget Outlook and Department Instructions” 30-page PowerPoint presentation. It wasn’t much in the way of a dog-and-pony show.
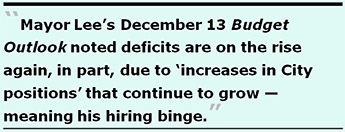
Slide #14 rhetorically asked why deficits are on the rise again; two of the Mayor’s explanations included rising employee costs largely related to pensions for City employees, and increases in City positions that continue to grow — meaning his hiring binge.
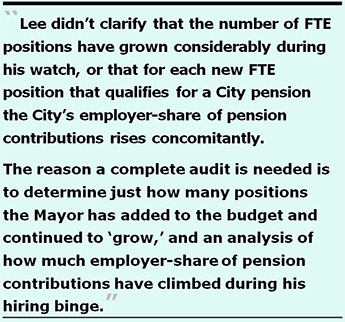
Gee, really? Lee didn’t clarify that the number of FTE positions have grown considerably during his watch, or that for each new FTE position that qualifies for a City pension the City’s employer-share of pension contributions rises concomitantly. The reason a complete audit is needed is to determine just how many positions the Mayor has added to the budget and continued to “grow,” and an analysis of how much employer-share of pension contributions have climbed during his hiring binge.
Slide #20 noted the City has added 5,090 FTEs for an 18% growth since Lee’s first budget submission in FY 2011–2012. (That number of 5,090 FTE’s may actually be much higher, but has not yet been confirmed.) The Mayor noted “new FTE’s also contribute to overall future [budget] deficits [since] employee benefits are rising faster than inflation,” and noted the City “must take a disciplined approach to future growth [in FTE’s] to ensure this level of total FTE’s is sustainable.”
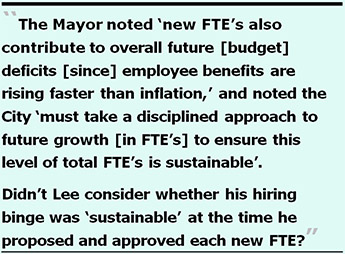 Now six years into his tenure, is the Mayor suddenly going to become “disciplined”? Didn’t Lee consider whether his hiring binge was “sustainable” at the time he proposed and approved each new FTE?
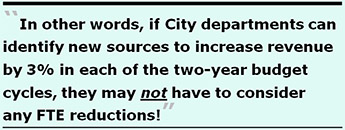
The PowerPoint presentation provided few instructions to City department heads on how to reduce their budgets for the two-year budget cycle to begin July 1, 2017 that will continue through June 30, 2019. Indeed, only on slide #23 did the Mayor “propose on-going reductions and revenue [increases] equal to 3% of adjusted General Fund support in each year.” In other words, if City departments can identify new sources to increase revenue by 3% in each of the two-year budget cycles, they may not have to consider any FTE reductions!
On the same slide, the Mayor appears to have found his kahunas when he indicated “Departments should not grow budgeted and funded FTE count[s].” I’ll believe it when I see it, because if Departments find a way to increase their revenues by perhaps 5% to 6% in each fiscal year, they may be able to sneak in “growing” the number of their budgeted FTE’s.
I say this, in part, because in 2009, while still employed as a secretary in the Rehabilitation Services Department at the City’s long-term care Laguna Honda Hospital, I proofread and formatted a budget submission application written by LHH’s Chief of Rehab Services, Dr. Lisa Pascual. She submitted a budget increase for additional physical and occupational therapists based on the premise that those clinicians would be able to increase billable Medicare Part A and acute-care rehabilitation admissions to the hospital to justify the increases in FTE counts.
 The budget submission was approved, the clinicians hired (who are still there), but there’s been no evidence to date that the number of acute-care rehab patients at LHH have increased, or that increased revenue generation ever happened to pay for the increase in budgeted staffing. If it looks good on paper, and a budget increase is approved, in the end it doesn’t matter whether it ever comes to pass as promised as having been “cost neutral” or “revenue-enhancing.” By then, the additional FTE’s are enthroned, pretty much until they start collecting City pensions.
 5,090 … and Counting
This again bears repeating: If the City Controller’s January 12 estimate that we may now have 34,005 FTE’s at the end of December 2016 holds true, that’s an increase of 3,379 FTE’s added between Heather Knight’s reporting in the Chronicle in August 2016 that as of the end of June 2016 there were 30,626 FTE’s, and now. Do we add those additional 3,379 FTE’s to the 5,090 reported in the Examiner that was also reported in the Mayor’s December 14 Budget Outlook presentation?
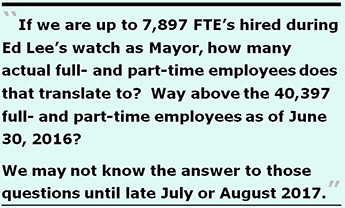
If we are up to 7,897 FTE’s hired during Ed Lee’s watch as Mayor, how many actual full- and part-time employees does that translate to? Way above the 40,397 full- and part-time employees as of June 30, 2016?
 We may not know the answer to those questions until late July or August 2017, when the Controller releases the data for FY 2016–2017 and the final FTE count for the current fiscal year is finally confirmed.
This also bears repeating: The City Controller’s Office admitted in December 2015 that of the $42 million in the City’s increased employer-share of pension contributions projected for FY 2016–2017, fully $14 million — 33.3% — was a direct result of adding additional new City employees. The math’s simple: The more employees, the higher employer-share of pension contributions that must be made.
Should increases to the City’s employer-share of pension contributions continue at this 33% rate, how much in actual dollar amounts will be attributable solely to the continued piling on of additional patronage-based FTE’s to the City’s payroll? How much more will taxpayers be on the hook for contributing to shore up the Pension fund?
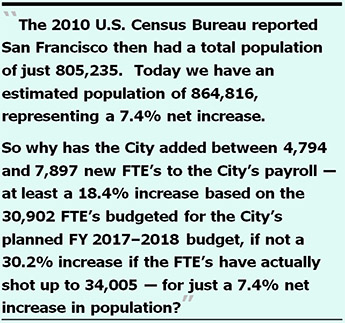
The 2010 U.S. Census Bureau reported San Francisco then had a total population of just 805,235. Today we have an estimated population of 864,816, representing a 7.4% net increase in City residents.
So why has the City added between 4,794 and 7,897 new FTE’s to the City’s payroll — at least a 18.4% increase based on the 30,902 FTE’s budgeted for the City’s planned FY 2017–2018 budget, if not a 30.2% increase if the FTE’s have actually shot up to 34,005 by December 31, 2016 — to accommodate approximately 60,000 new San Franciscans, a 7.4% net increase in population? Is anything out of whack here between a modest increase in the population, and the Mayor’s glut of a hiring binge?
When Professional “Best-Guess” Estimates Go Bad
 The SEFRS external actuarial consultant, Cheiron, presented on February10, 2016 a summary of employer-share of contributions to the Retirement Fund in its annual “Funding Actuarial Valuation Results.” As Figure 1 shows, Cheiron reported (page 9) that for the fiscal year ending June 30, 2016, it “estimated” the city would have a $2.739 billion dollar payroll, and so the City’s share of contributions after “cost-sharing adjustments” with City employees would be an estimated $527 million in net employer contributions to the pension fund
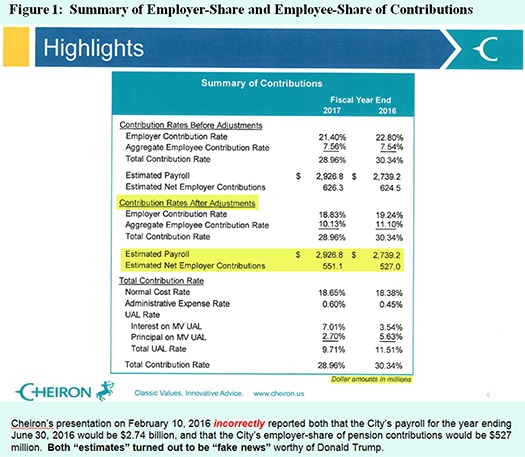 Problem is, the City Controller’s payroll database for the same period ending June 30, 2016 shows the City had, in fact, an approximate $2.8 billion dollar payroll based on “regular” (base pay). So Cheiron was off by a minimum of $61 million in the actual, not estimated, payroll.
However, it’s thought that based on City contracts with the Police Officers Association and other labor unions, the City’s payroll to calculate the employer-share of pension fund contributions is calculated not just on “base” pay, but also on other factors such as overtime pay for employees hired prior to November 2, 1976 and still working, and types of “other pay” included in the City’s total payroll.
One beneficiary of the pre-1976-hire overtime provision to calculate toward his eventual pension is Fire Department Captain Joe Driscoll, who was hired in July 1974. Driscoll — an elected member of the San Francisco Employees’ Retirement System board of directors — racks up significant amounts of overtime year in and year out, which will count towards his eventual retirement check.
In the fiscal year ending June 30, 2016, in addition to Driscoll’s base pay of $149,554 he racked up $104,286 in overtime pay and $34,630 in “other pay,” for a combined $288,470 in total pay, all of which may be factored in when his pension is calculated.
For example, in the January 2014 edition1 of the POA Journal published by the Police Officers Association, it noted that there are several types of additional pay that is considered “pensionable” and included in their pension calculations, including, their uniform allowance, their 2% Longevity Pay, the 2% Senior Officer/ Sergeant Pay (for those working the midnight shift with 25 years of service), and their 4% Retention Pay after working for the Police Department for 30 years.
 In addition, police officers receive a half-hour of pay each day for donning and doffing their uniforms before and after their scheduled shifts. That “regular” pay to dress and undress is factored into their eventual pensions as pensionable base bay.
Cheiron may not have factored in these other “pensionable” benefits.
If that’s the case, Cheiron’s estimate2 in February 2016 of the City’s total payroll for the period ending on June 30, 2016 may have been off by millions of dollars above the probable $61 million variance, since the total City payroll3 had climbed to $3.167 billion by the end of June 2016, not the $2.739 billion that Cheiron had estimated and presented on February 10, 2016, fully seven months into the fiscal year.
 Is that the best Cheiron can do to estimate the total payroll seven months into a fiscal year?
It is not known how much higher the actual net employer-share of contributions should have been above Cheiron’s February 2016 estimate of $527 million. The probability is Cheiron’s estimate of employer-share of contributions was probably seriously under-reported, given that the City’s eventual total payroll turned out to be $60.8 million (in just base pay) to $408 million (in total pay) higher.
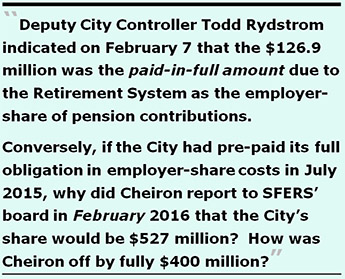
The City Controller’s Office responded on February 6 to a records request seeking to learn how much the City actually contributed as its employer-share of pension contributions for the fiscal year that ended on June 30, 2016. It turns out the City paid just $126.9 million — apparently not a partial payment, but a pre-paid payment in full — towards the City’s employer-share of pension contributions for the period ending June 2016, fully $400 million less than Cheiron’s estimated employer-share of contributions presented in February 2016 to the Retirement Board. How did Cheiron get it so wrong?
In a follow-up response, Deputy City Controller Todd Rydstrom indicated on February 7 that the $126 million was the paid-in-full amount due to the Retirement System as the employer-share of pension contributions. Rydstrom indicated that amount was based on the FY 2015–2016 actuarially determined SFERS rates for the year and was, in fact, prepaid at the beginning of the fiscal year (presumably sometime in July 2015) instead of in installments throughout the fiscal year.
 This begs two questions: First, if Cheiron did not release its “Funding Actuarial Valuation Results” report until it presented the actuarial valuation to SFERS Board on February 10, 2016 indicating that the City’s estimated employer-share of contributions would be $527 million, how did the City know in July 2015 that the “in-full” amount was just $126.9 million that the City then pre-paid?
Second, and conversely, if the City had pre-paid its full obligation in employer-share costs in July 2015 of just $126.9 million, why did Cheiron report to SFERS board in February 2016 that the City’s estimated share would be $527 million?
How was Cheiron off by fully $400 million? Are there two sets of “books” — actuarial reports — here? And shouldn’t Cheiron have known by February 2016 the City had already pre-paid its employer-share of contributions back in July 2015?
 Who’s auditing the patronage hiring-binge cookie jar? Anybody? When will San Franciscans get this overdue audit to counter-act the Mayor’s hiring deceit?
As prominent broadcast journalist Rachel Maddow reported on her show on MSNBC Wednesday night, February 1, dissent and protest are the big things happening in our country’s politics right now. It should be the same with protest by City taxpayers and City employees over Ed Lee’s now six-year misguided and unsustainable hiring binge.
When it comes to monitoring, auditing — or ending — Mayor Lee’s six-year hiring binge, I’m reminded of Maddow’s frequent admonition: Watch this space.
Monette-Shaw is a columnist for San Francisco’s Westside Observer newspaper, and a retired San Francisco City employee. He received a James Madison Freedom of Information Award in the “Advocacy” category from the Society of Professional Journalists–Northern California Chapter in 2012. He’s a member of the California First Amendment Coalition (FAC) and the ACLU. He can be contacted at monette-shaw@westsideobserver.com.
1 POA Journal, January 2014, Volume 46 Number 1, page 6.
2 Cheiron's July 1, 2015 “Actuarial Valuation Report” presentation to SFERS on February 2, 2016; downloaded from SFERS’ website on February 6, 2017.
3 San Francisco City Controller’s payroll database fiscal year ending June 30, 2016 received on August 23, 2016.
4 When this article was first posted on-line on February 8, 2017 San Francisco’s City Controller had still not responded to a records request for the number of FTE’s on the City’s payroll as of December 31, 2016. We still don’t know whether the number of FTE’s at the end of calendar year 2016 has climbed to 34,005 — or how much higher than 5,090 it may still be climbing — nor do we know whether the 40,397 full- and part-time employees on the City’s payroll as of June 30, 2016 has also climbed higher, and by how much.