 Article in Press Printer-friendly PDF file
Westside Observer Newspaper
Article in Press Printer-friendly PDF file
Westside Observer
Newspaper
September 2019 at www.WestsideObserver.com
Vote “No” on Prop. “A”: Lottery in Bond Disguise (72 ≠ 517)
Who November Affordable Housing Bond
Leaves Behind
by Patrick Monette-Shaw
During the Board of Supervisors Rules Committee hearing on July 11, 2019 Supervisor Sandra Lee Fewer repeatedly rhetorically asked: “Who are we leaving behind?”
How large does the elephant in the room have to be?
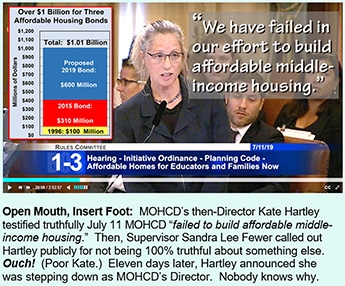
If voters approve the $600 million Affordable Housing Bond this November, we’ll be up to just over $1 billion across three general obligation bonds for affordable housing, with little to no middle-income housing to show for it. Sadly, it’s an Affordable Housing lottery in disguise, masquerading as a bond.
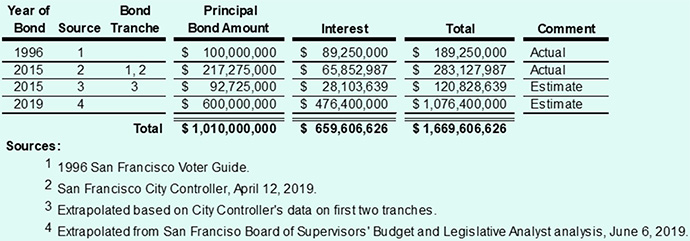
 In addition to the $1 billion principal on the bonds, it will cost another $659.6 million in estimated interest on the bonds, for a projected total of $1.67 billion in costs to pay them down.
And City Hall is advocating that additional affordable housing bonds be put before voters every five years or so. What are we getting for this spending?
I recommend voting against the 2019 Bond for reasons presented here.
In the four years since September 2015 I’ve published six articles in the Westside Observer about the $310 million Affordable Housing Bond voters passed in November 2015. Let’s review, again.
The first thing I learned was that data provided by the Mayor’s Office of Housing and Community Development (MOHCD) — in particular, data from its now former-director, Kate Hartley — isn’t always truthful, and sometimes is intellectually dishonest. After all, 55 + 72 ≠ 517. As well, 72 ≠ 517 either, as you’ll see below.
 As we head to the November election, Hartley’s not alone. Mayor London Breed isn’t being truthful either about November’s $600 million Affordable Housing Bond or her initial separate Initiative Ordinance to re-zone all public land citywide. That Breed and Hartley aren’t being truthful shouldn’t come as too great of a surprise!
If passed, the November 2019 bond will push San Francisco over the one-billion-dollar threshold in affordable housing bond spending. The pathetic performance of both the 1996 and the 2015 Affordable Housing Bonds portends that the drunken sailor 2019 Affordable Housing Bond is poised to repeat throwing good money after bad!
November 1996 $100 Million Bond Failure
Back in 1996, then-Mayor Willie Brown told voters that a $100 million housing bond — to be issued in $20 million increments each year over a five-year period — would split 85% of the Bond ($85 million) to development of affordable rental housing, and 15% ($15 million) would be used for downpayment assistance loans for low- and moderate-income first-time homebuyers. Brown’s promise was to build 3,000 new apartments and offer home ownership loans to 1,000 families.
Voters fell for the ruse, and passed the 1996 Bond.
Six years later, in the November 2002 voter guide Mayor Brown asserted that 1,812 new and rehabilitated apartments had been built from the 1996 Bond, and 240 downpayment loans had been issued to help San Franciscans buy homes. It was Brown’s first admission that rehabilitated units had been funded by a Bond that had promised new units would be built. Obviously, producing only 1,812 units accomplished just 60% of the promised 3,000 units; 60% represents a failing grade.
 An audit was performed, and a newspaper investigation uncovered that less than half of the promised units were built (perhaps only 1,342), and only 340 of the 1,000 loans were issued. Why the audit found 340 loans had been issued, while Brown claimed only 240 loans were issued, isn’t known. Either way, less than one-third of the promised loans materialized.
Voters Wised Up and Rejected Two More Bonds
 Given key failures of the 1996 Bond, voters wised up and rejected the next two affordable housing bonds. A $250 million affordable housing bond in November 2002 was rejected when only 55.84% of voters cast a “Yes” vote, short of the needed 66.6% of ballots cast to pass it. Two years later, voters rejected another $200 million bond in November 2004 when only 64.2% of voters cast a “Yes” vote, again short of the 66.6% needed to pass it. It was clear voters were tired of being lied to.
Had the two bonds passed for a total of $450 million, we might be facing closer to $1.5 billion in principal on Affordable Housing Bonds, plus an additional $1 billion in debt service on the bonds. Voters should reject the 2019 Bond, too, based on poor performance of the 1996 Bond and the 2015 Bond.
November 2015 $310 Million Bond Spending Disaster
Before voting on whether to approve the $600 million Affordable Housing Bond proposed for the November 2019 ballot, voters should consider the performance of the second Affordable Housing Bond for $310 million they approved in November 2015. There are obvious problems with the 2015 Bond, like with the 1996 Bond, spanning a whole host of issues that amount to another disaster:
 Bond Spending Delay: Here we are almost four years after voters passed the Bond in November 2015, and 30.5% ($92.5 million) — the third tranche1, or slice — of the bonds have not been issued and won’t be until sometime after October 2019. What’s taking so long? The slow pace of issuing the bonds, delaying project construction, remains troublesome. If Mayor Breed really wants to streamline existing policies and “processes” to cut affordable housing development time, she should speed up issuing bonds passed by voters.
 Breed should have known — or MOHCD should have informed her — that of the $29 million being allocated to the Francis Scott Key teacher housing project from the 2015 Bond, $26 million of it won’t be allocated until the third bond tranche is issued sometime after October 2019. You can’t break ground and start building something that hasn’t received fully 90% of its bond-funded allocation!
“The true reason for the dilatory movement at the Francis Scott Key project is due to [a] developer [MidPen] that doesn’t know how to work in San Francisco and [had] not truly chosen by the School District.”
It’s not clear if Supervisor Walton knew that the seven-member independent “selection panel” that recommended awarding the development to MidPen had, in fact, included two representatives from the San Francisco Unified School District, so while the school district may not itself have selected MidPen, the school district did have input in recommending MidPen.
 There you have it: Mayor Breed could have learned from Supervisor Walton that MidPen doesn’t have experience working in San Francisco, and that — more than anything else combined — may be the true reason why the teacher housing project is so far behind schedule and hasn’t broken ground, not that the land needed to be re-zoned. Walton totally destroyed Breed’s pretext all public land (except parks) in San Francisco needs to be re-zoned in one fell swoop, when the real problem appears to be a developer lacking experience in San Francisco.
Indeed, the rating sheet’s from MOHCDs seven-member selection panel ranked MidPen the lowest of four proposals submitted, with a score of just 30 points out of 40 possible points on overall Experience. The selection panel also ranked MidPen the lowest of the four proposals on “Developer Experience, with a score of just 15 out of a possible 25 points, in part because MidPen only qualified on one of its two submitted “Qualifying Projects.” MidPen apparently didn’t submit a Qualifying Project of new construction actually built in San Francisco.
Although Supervisor Walton didn’t note it on July 11, and MOHCD had not indicated previously, Breed should have known that Daniel Adams had been re-hired in August 2017 as MOHCD’s Deputy Director of Housing after Adams’ four-year hiatus working for BRIDGE Housing Corporation for two years as Director of Development, and for two years before that was the Director of Housing Development for MidPen Housing Corporation.
Didn’t anybody notice that MOHCD had issued its RFP for the Francis Scott Key site two months after Adams returned as an MOHCD Deputy Director, and eight months after his return to MOHCD the development rights were awarded to Adams’ former employer, MidPen? Am I the only one scratching my head?
On July 22, 2019 news surfaced that Kate Hartley was suddenly stepping down as MOHCD’s director, and Mr. Adams was appointed Acting Director of MOHCD. Nobody at City Hall seems to know — or won’t comment on publicly — what caused Hartley’s sudden ouster.
“The primary metric of success for the Affordable Housing Bond is number of units produced, protected, or assisted.”
 Using a single metric to assess bond performance is silly, and clearly insufficient. Inflating total unit counts by including counting as “units” projects that only receive “assistance” via infrastructure funding is misleading — and untruthful (to use Supervisor Fewer’s words) — because those projects don’t receive funding for vertical construction of units, and other sources of funding are used for constructing the actual units.
Is MOHCD double counting “infrastructure units” as a Bond accomplishment that are actually being constructed by other funding sources?
Follow the (“Unit Counts”) Bouncing Ball
Given its incentive to focus only on the number of units, MOHCD appears to have fluffed up some of its numbers. Figure 1 illustrates how the total unit count has bounced around over time.
Figure 1: Shifting Unit Counts Across MOHCD Quarterly Reports
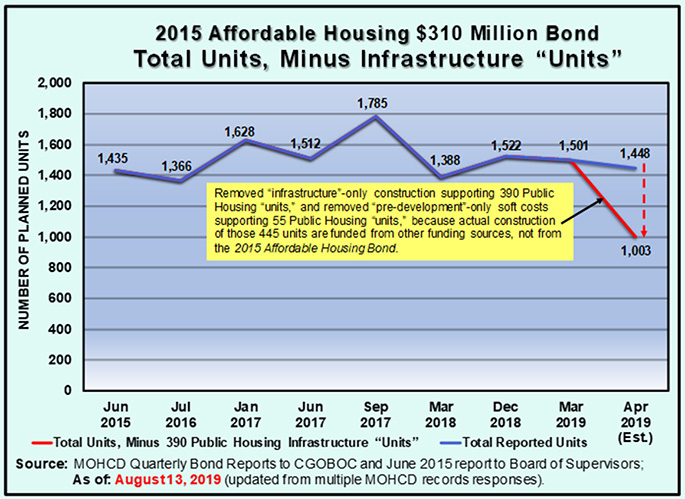
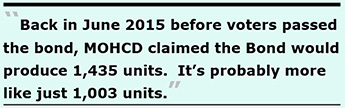 Back in June 2015 before voters passed the bond, MOHCD claimed the Bond would produce 1,435 units. In September 2017, MOHCD asserted 1,785 units would be produced. It’s probably more like just 1,003 units.
Although not prominently shown in Figure 1, other MOHCD reports document that:
 Add the loss of the 53 senior housing units at 735 Davis to the loss of 56 planned senior units funded by the 2015 Bond when MOHCD eliminated the senior housing project at 250 Laguna Honda Boulevard and replaced it with a 94-unit senior housing project at 1296 Shotwell, and we’re at a total loss of 109 units for seniors funded by the 2015 Bond.
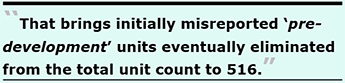 Then, after previously reporting 130 low-income units would be developed in the Mission District at 681 Florida Street in its December 18 report to CGOBOC, MOHCD then removed those 130 units from its March 2019 quarterly report to CGOBOC, again because it was ostensibly a pre-development project that should not have counted units. That brings the initially misreported “pre-development” units eventually eliminated from the total unit count to 516 (and for all we yet know, the 516 figure may be even higher).
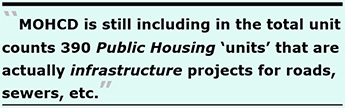 However, MOHCD is still including in the total unit counts 390 “units” in the $80 million Public Housing category that are actually infrastructure projects for roads, sewers, etc., only to “support” the 390 units that are being constructed from other sources of funding and are not funded from the 2015 Housing Bond. The actual number of total units being produced was probably closer to just 1,058 units (before excluding the 53 units at the Davis Street project defunded from the Bond) — not 1,501 units and certainly not 1,613 units. Claiming 1,613 units are being produced is a 52.5% change increase above 1,058 units.)
It’s helpful to review the shifting number of planned units in each of the four main categories in the 2015 Bond.
Table 1: Shifting Unit Counts in Bond Main Categories
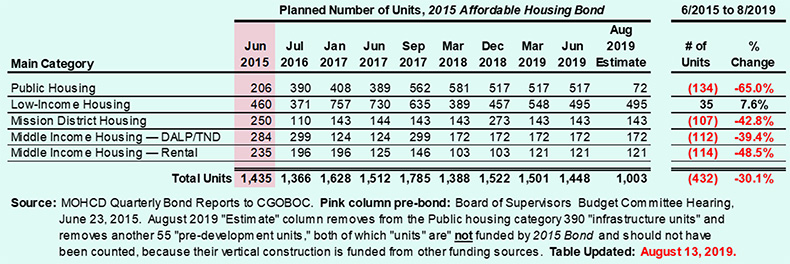
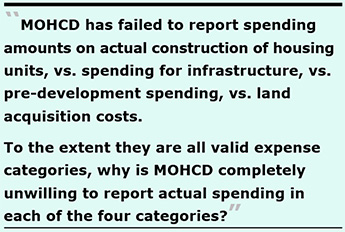 All along, MOHCD has failed to break out and report to CGOBOC members, the Capital Planning Committee, and the Board of Supervisors — let alone to taxpayers and members of the public — the actual spending amounts on vertical construction of new, rehabbed, or replacement units, vs. the actual amount of spending on infrastructure, vs. pre-development spending, vs. land acquisition costs. To the extent the four categories — site acquisition, infrastructure preparation, pre-development, and construction of units — are all valid expense categories to bring affordable housing to fruition, why is MOHCD completely unwilling to report the actual spending in each of the four categories?
After all, each of the four categories are valid metrics by which to assess efficacy of Bond spending.
Sadly, MOHCD has not presented to CGOBOC (and CGOBOC members have failed to ask for) a breakout of how much of the 2015 Bond is being spent on each of the four categories, and MOHCD hasn’t presented the data to the Board of Supervisors, either, let alone providing it to members of the public. Nor is MOHCD presenting a breakout of how much of the 2019 Bond will go to each of the four categories, a key metric voters may want to learn before voting in November 2019.
Intellectual Dishonesty: 55 + 72 ≠ 517
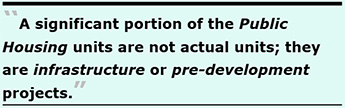 Since January 2016, MOHCD has been counting and reporting in its quarterly reports to CGOBOC that somewhere between 206 and 517 new or replacement housing units — and at one point, up to 581 units — would be included in the Public Housing category of projects funded by the 2015 Bond. (Actually, it may be 127 units at best, and 72 units at worst, as shown in Figure 1 and Table 1.) A significant portion of the Public Housing units are not actual units; they are infrastructure or pre-development projects, relying on other non-Bond sources of funding for actual construction of the units.
Infrastructure projects typically involve things like new streets and infrastructure such as gas, water, sewer, electricity, data, auxiliary water supply system (fire suppression), new sidewalks and streetlights, landscaping, trees, and traffic control signs and striping — but not new or rehabilitated housing units.
In response to a records request placed on June 26 about how much of two infrastructure projects promising 390 units in the Public Housing category funded by the 2015 Affordable Housing Bond would fund vertical construction of actual housing units vs. funding only infrastructure expenses, Hartley finally acknowledged in a July 15 e-mail response:
“[The 2015] Prop A [general obligation] bonds will only fund the infrastructure for those [Potrero HOPE SF] units. Because the infrastructure investment is large [$20 million], and because the vertical construction is not possible without this investment, we are counting the the investment toward the total unit count produced. … The vertical construction of new housing [at Sunnydale HOPE SF] will be funded from other sources. Like Potrero, the infrastructure investment here, over $10 million, is significant enough to count the units.”
Separately, Hartley indicated on July 8 that the approximately $20 million for one infrastructure project for the Potrero HOPE SF site will include a new segment on Arkansas Street between 25th and 26th Streets, other streets will be rebuilt, and the steep 20% grade (slope) on 25th Street will be flattened. She also indicated that approximately $10 million in infrastructure for the Sunnydale HOPE SF site will include two brand new streets, a pedestrian mews (a lane between structures), and realignment of Sunrise Way.
 Because both investments are “large” and “significant,” MOHCD decided to count the 390 units only being “supported by” the infrastructure investments toward the reported total 517 public housing unit subtotal. (Fully 125 of the 390 units are, by MOHCD’s own admission, market-rate units being supported by the infrastructure spending.) The combined $30 million represents 37.5% of the $80 million set aside in the 2015 Bond for public housing projects, but MOHCD has not reported — and CGOBOC members and the Board of Supervisors haven’t bothered to ask — how much of the remaining $50 million in the Public Housing category is also being dedicated to infrastructure improvements rather than to vertical construction of actual housing units.
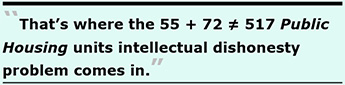
That’s where the 55 + 72 ≠ 517 Public Housing units intellectual dishonesty problem comes in. The projected 217 “units” in the Potrero Phase II infrastructure project, and the projected 173 “units” in the Sunnydale Block 6 infrastructure project are not being funded by the 2015 housing bond. Actual construction of the combined 390 units wrongly counted in the two infrastructure projects are being funded by other sources of funding, not by the 2015 bond. Obviously, 127 ≠ 517, as Ms. Hartley must know but appears to have chosen to continue untruthfully padding as housing production numbers.
Two additional projects are funding another 127 Public Housing units: 55 units at the Sunnydale “Parcel Q” site, and 72 units at the Potrero “Block X” site. In response to another records request placed on July 17 about how much of the two additional projects for 127 units would actually fund vertical construction of actual housing units vs. funding only infrastructure expenses, Hartley admitted in a July 22 response:
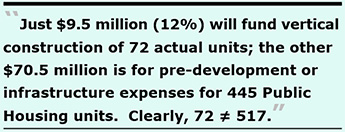 There you have it: Of the $80 million set aside in the 2015 Bond for Public Housing, just $9.5 million (12%) will fund vertical construction of 72 actual units; the other $70.5 million is for either pre-development or infrastructure expenses for 445 Public Housing units. Clearly, 72 ≠ 517 Public Housing units, either.
When MOHCD made corrections in December 2018 to the methodology it uses to count units by excluding counting units in pre-development-only funded projects, why didn’t MOHCD also exclude from the methodology not counting units in infrastructure-only funded projects whose vertical construction of the actual units are from other, non-Bond, funding sources?
“Failure to Build” Middle-Income Housing
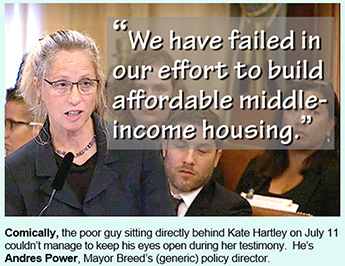
On July 11, 2019 Ms. Hartley may have inadvertently blurted during her opening presentation to the Board of Supervisors that “We have failed in our efforts to build affordable middle-income housing.” She admitted a lot, lot more damning information about the failure to build middle-income housing, discussed in more detail below.
The context of that hearing was to consider whether the Board of Supervisors would sign on to, and place on the November 2019 ballot, Mayor Breed’s proposed Charter change that would have altered the definition of affordable housing by increasing eligibility to 140% of AMI and enshrining the definition in the City charter. It may have been Hartley’s gambit to expand the definition of “middle income,” perhaps to help reduce the sting from the City’s failure to actually produce middle-income housing. (Hartley’s gambit didn’t work. Breed’s Charter change was essentially dead on arrival.)
 It should be noted that 140% of AMI in San Francisco for 2019 translates to $120,700 for a one-person household, and $172,400 for a four-person household. Enshrining that income level as the upward definition of middle-income affordable housing in the City charter was a bridge too far, since it would have essentially subsidized housing — and housing developers focusing on building — for the relatively wealthy, as if solicitude for the wealthy may have been Breed’s bridge, her shout-out to developers.
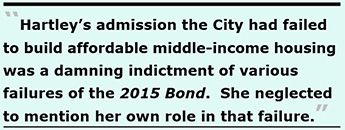
Hartley’s admission the City had failed to build affordable middle-income housing — open mouth, insert foot — was a damning indictment of various failures of the 2015 Affordable Housing Bond. She neglected to mention her own potential role in that middle-income housing failure.
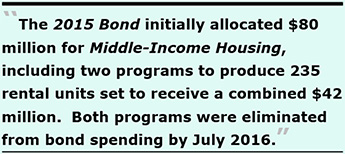 The 2015 Bond initially allocated $80 million for Middle-Income Housing, including two programs to produce 235 rental units set to receive a combined $42 million: A Middle-Income Rental Program ($17 million) and a separate Expiring Regulations Preservation ($25 million) project.
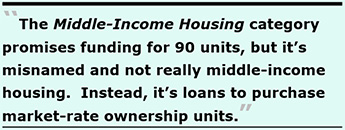
The two programs were introduced to CGOBOC in January 2016, with the Middle-Income Rental Program having been explicitly named in the question on the ballot put before voters in the November 2015 election and included in the legal text in the voter guide. The Middle-Income Rental Program was designed to prioritize family-sized units. Both programs were eliminated from bond spending by July 2016, with no apparent comment from, or objections by, CGOBOC members. Fully $20 million of the Middle-Income Housing funds were re-allocated in 2018 to downpayment assistance loans (DALP) to purchase market-rate units, increasing the DALP allocation to $34.4 million.
 As previously reported, given the temporal proximity in time, some observers wondered (and continue to wonder) whether MOHCD decided after voters passed Proposition “C” in June 2016 — dealing with increasing the inclusionary percentages of affordable units required for market-rate development projects — that MOHCD could unilaterally remove the Middle-Income Rental program from the 2015 Affordable Housing Bond a month later in July 2016.
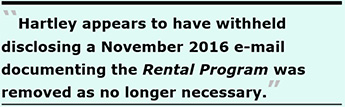
Hartley appears to have withheld disclosing a November 2016 e-mail documenting the Rental Program was removed as no longer necessary following passage of Prop. “C.”
 Notwithstanding Hartley’s prevarication and unconvincing denial, some observers remain unconvinced and believe passage of Prop. “C” contributed to MOHCD eliminating the Middle-Income Rental Program from planned Bond spending. It may not have been the only time Hartley had been untruthful, as Supervisor Fewer eventually noted.
Unfortunately, members of CGOBOC — and by extension, members of the Board of Supervisors — have raised virtually no concerns about MOHCD’s stewardship of the 2015 Bond presented here, and in particular MOHCD and CGOBOC appear to have raised no concerns about elimination of the Middle-Income Rental Program that was initially projected to create 235 middle-income rental units.
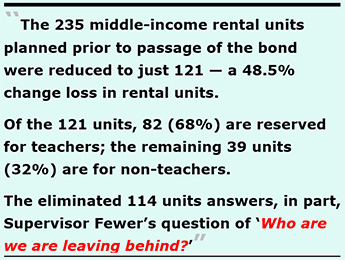
Indeed, the 235 middle-income rental units planned prior to passage of the bond were reduced to just 121 — a 48.5% change loss in rental units. The eliminated 114 units answers, in part, Supervisor Fewer’s question of “Who are we are leaving behind?”
Of the 121 units, 82 (68%) are reserved for teachers, and just 39 (32%) of the middle-income rental units are available to non-teachers. Alternatively, the 39 units represent 3.9% of the 1,003 probable units funded by the $310 million 2015 Bond.
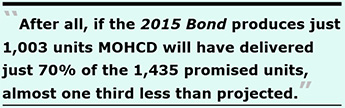 After all, if the 2015 Bond produces just 1,003 units MOHCD will have delivered just 70% of the 1,435 promised units, almost one third less than projected. No wonder voters feel betrayed and perhaps lied to. Strike two, you’re almost out?
MOHCD isn’t scheduled to make its next formal presentation on the status of the 2015 Bond to CGBOC until January 2020. We’ll have to wait to see what else MOHCD changes, eliminates, or accomplishes, with bond performance.
November 2019 $600 Million Bond
MOHCD and the City are promising voters and the public that the $600 million November 2019 Affordable Housing Bond will deliver producing or preserving 2,755 units. They’re saying so with a straight face, despite the 1996 Bond and 2015 Bond failures to produce the projected number of units.
Initially, Mayor Breed had proposed a second $300 million Affordable Housing Bond for the November 2019 election. By May 2019, it had been increased to a $500 million bond, approved by the Capital Planning Committee.
 On July 9, the Board of Supervisors approved increasing it to a $600 million bond, after the City Controller re-analyzed the City’s existing general obligation bond debt load and approved the additional $100 million bond increase.
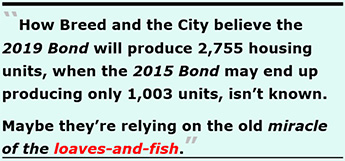
The final 2019 Affordable Housing Bond Report updated following the Board of Supervisors June 13 Budget and Finance Committee hearing now claims up to 2,755 “affordable homes” across six categories of projects will be produced or preserved by the third bond in 2019, nearly triple the 1,003 units funded by the 2015 Bond: How Breed, MOHCD, and the City believe the $600 million 2019 Bond will produce 2,755 housing units — nearly triple the number of units — when the $310 million 2015 Bond may end up producing only 1,003 units, isn’t known. Maybe they’re collectively relying on the old miracle of the loaves-and-fish.
The six categories were identified, in part, by four focus groups convened by president of the Board of Supervisors, Norman Yee and Mayor Breed.
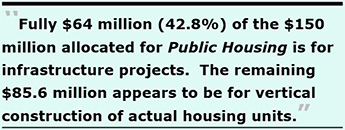 As of April 30, 2019 the Excel file itemizes that $64 million (42.8%) of the $150 million allocated for Public Housing is for infrastructure projects, including re-alignment of Sunnydale Avenue, new streets (Arkansas and Missouri), complete re-alignment of Santos Street and part of Blythdale Avenue to connect to Sunrise Way, re-alignment of Connecticut and 23rd Street, and extension of 24th Street. Other infrastructure projects include major regrading and street infrastructure such as gas, water, sewer, electricity, data, fire suppression water supply, and new sidewalks, streetlights, landscaping, trees, traffic control signs, and striping.
 Ms. Hartley indicated on July 2, 2019 that only the Public Housing category of the 2019 Bond has identified specific projects, in part because regulatory laws require environmental clearance before committing funds to official “projects” and the Sunnydale and Potrero public housing projects has already undertaken and approved a full Environmental Review process.
The other five main categories in the 2019 Bond include:
 Affordable Housing Preservation, $30 Million: MOHCD will either issue a new NOFA, or amend an existing NOFA, to preserve approximately 90 units for current residents at risk of losing affordability through unlawful evictions or in buildings in physical decline that are at imminent risk of conversion to market-rate rents in neighborhoods with limited affordable housing production, or neighborhoods with documented high eviction rates.
[For DALP loans …] “Upon resale, the program receives a share of the capital gains equal to its share of the initial equity invested. For example, if DALP contributes 5% of the purchase price, and the owner puts 15% down, then upon resale, the City is entitled to 25%, or 5% ÷ (5%+15%) of the [capital gains] profit.
Because of this debt-to-equity feature, and San Francisco’s generally rising home prices, the program is likely to be profitable for the City over the long run, making it very advantageous from a cost-benefit point of view.”
Consider one true example: MOHCD issued DALP Loan # 09-1075 in October 2009 by awarding a $90,000 DALP loan to a first-time homeowner to purchase a $410,000 home. The home was re-sold just under five years later in June 2014 for $725,000, netting the borrower $315,000 in appreciation. The City netted 22% of the appreciation — $69,300 — with a total of $159,300 repaid to the City. “Sharing” in the capital gains appreciation is clearly highly profitable for MOHCD and the City, as San Francisco’s Office of Economic Analysis noted in 2015.
After paying the City $69,300 for the City’s share of appreciation, the homeowner was able to flip the property after just five years of ownership, and was able to walk away — pocketing $245,700 in homeowner profit.
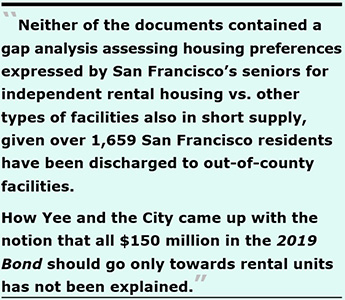 Neither of the two documents contained a gap analysis assessing housing preferences expressed by San Francisco’s senior populations for independent rental housing, vs. affordable board-and-care homes, vs. assisted living facilities, vs. skilled nursing facilities. This is important precisely because over 1,659 San Francisco residents have been discharged to out-of-county facilities due to a severe shortage of such facilities in San Francisco. How Yee and the City came up with the notion that all $150 million in the 2019 Bond should go only towards rental units has not been explained.
Again, a significant portion of the 2019 Bond may go towards pre-development expenses and infrastructure expenses, rather than to actual construction, like the 2015 Bond had.
 Unfortunately, there will be less oversight of performance of the 2019 Bond. CGOBOC members voted in 2019 to change its procedures, and will now receive a formal presentation only once each year from any given bond’s City department sponsor. The once-per-year presentations will be augmented in between formal presentations with a status update presented by the CGOBOC member assigned as the CGOBOC liaison to a City department. That means CGOBOC will receive a formal presentation on the 2019 Bond only once each year from MOHCD staff members, and approximately six months later will receive a status update from a CGOBOC member appointed as the liaison to MOHCD.
Given CGOBOC member oversight failures on the 2015 Bond, oversight of performance of the 2019 Bond will be less robust.
Reviewing the Combined $1 Billion in Bonds
As discussed above, less than half of the units promised from the $100 million 1996 Bond were built, and approximately 70% of the promised units from the $310 million 2015 Bond may eventually be built. Sadly, the 82 rental units for teachers at the Francis Scott Key Annex site are projected to be completed in 2022, seven years after passage of the 2015 Bond.
Should the $600 million 2019 Bond be passed by voters, what are we getting for the over $1 billion across the three Affordable Housing Bonds?
One clue is in the Economic Impact Report prepared by San Francisco’s Office of Economic Analysis for the 2015 Bond noted above. The report noted the 2015 Bond proposal would focus on four policy areas, including rehabilitation of existing public housing units, acquisition of existing rent-controlled apartment buildings, and downpayment assistance to first-time homebuyers.
But the fourth policy area was the most telling, involving directly funding construction, development, and rehabilitation of new affordable housing, or alternatively indirectly funding housing construction through increased incentives to developers of market-ratehousing. The report noted:
“Construction, development, and rehabilitation of new affordable housing, either directly or through increased incentives to developers of market-rate housing.”
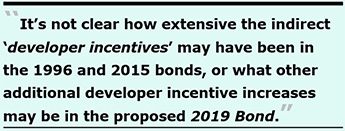 It’s not clear how extensive the indirect “developer incentives” may have been in the 1996 Bond and 2015 Bond, or what other additional developer incentive increases may be being included in the proposed 2019 Bond.
So, what categories of housing are we getting for the $1 billion across the three bonds? Table 2 provides some clues.
Table 2: Uses of Three Combined Affordable Housing Bonds
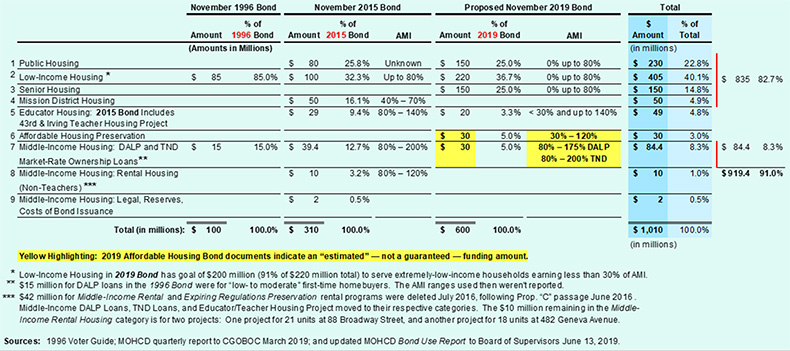
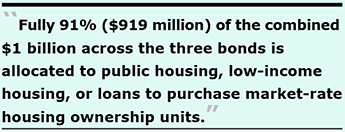 Just 9% ($91 million) of the combined $1 billion is allocated to other categories of housing, including 1% ($10 million) for 39 middle-income rental housing for non-teachers, 4.8% ($49 million) for educator-only housing, and 3% ($30 million) for other affordable housing preservation.
The bonds should be renamed from “Affordable Housing Bonds” to either “Low-Income and Market-Rate Housing Bonds” or to “Affordable Housing Lottery” to reflect truth-in-advertising of who the majority of the bonds are benefiting.
Then there’s the issue of what income levels the so-called affordable housing is targeted to. Figure 2 shows the AMI (Area Median Income) levels of the eight major bond categories.
Figure 2: AMI Eligibility Levels of Three Combined Affordable Housing Bonds
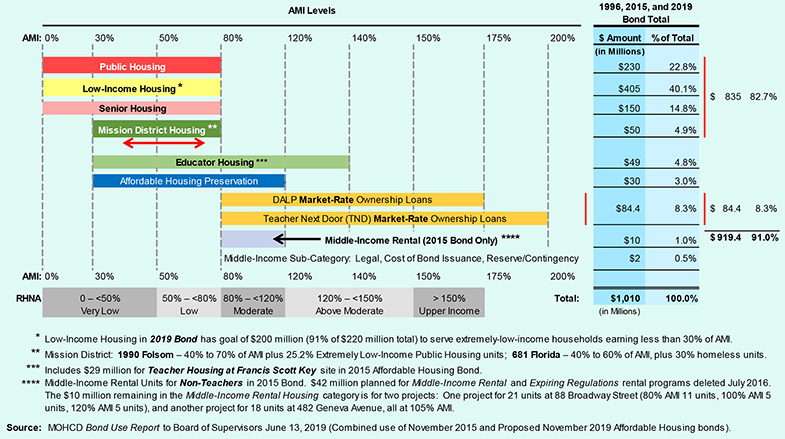
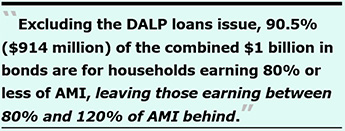 Excluding the DALP loans issue, 90.5% ($914 million) of the combined $1 billion in bonds are for households earning 80% or less of AMI, leaving those earning between 80% and 120% of AMI behind.
Highly Profitable DALP Loans
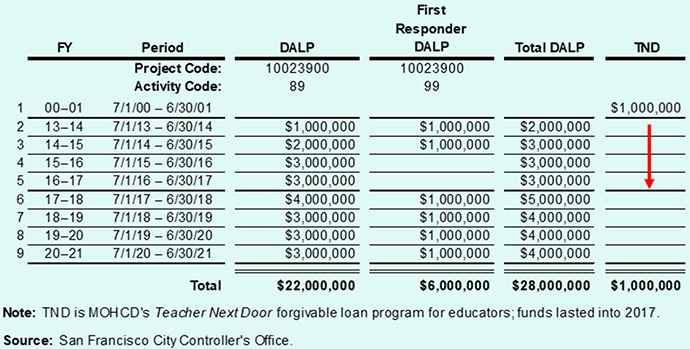
In addition to the $84.4 million for DALP and TND loans funded across the three Affordable Housing Bonds, Table 3 shows the city budget has separately added $28 million for DALP loans from the general fund since Fiscal Year 2013–2014 for a total of $112.4 million in DALP loans, plus another $1 million for TND loans.
Table 3: Non-Bond, City Budget Allocations for DALP and TND Loans
The $112.4 million for DALP loans issued between the City budget and the Affordable Housing Bonds will be very profitable for the City. In my May 2015 Westside Observer article, “Housing Withers on the Vine,” I reported:
“Indeed, MOHCD separately provided a list of 157 Downpayment Assistance Loan Program (DALP) loans issued between June 1998 and January 2013 and subsequently were repaid; the list shows that of $9,583,879 in DALP loans issued, on re-sale of the properties the City’s share of appreciation netted the City $4,572,156 in addition to the loan repayments. The City’s share of the appreciation represents 47.7% of the $9.58 million in [DALP] loans MOHCD [had] issued.”
 By extrapolating the profitability from the City’s share of appreciation from the first 157 DALP loans, the City may end up collecting $54 million in City share of appreciation on the $112.4 million in DALP loans funded by the City budget and funded from the Affordable Housing Bonds. No wonder the Office of Economic Analysis indicated in 2015 that the DALP program will be highly profitable to the City over the long term.
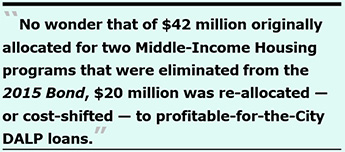
And no wonder that of the $42 million originally allocated for two Middle-Income Housing programs that were eliminated from the 2015 Bond, $20 million was re-allocated, or cost-shifted, to rofitable-for-the-City DALP loans.
Cumulative Interest on the $1 Billion in Bonds
In addition to the $1 billion in principal across the three Affordable Housing Bonds, interest on the debt adds another $659.6 million in costs to taxpayers:
Table 4: Debt Service Interest on the Bonds
Had the City funded many of these housing projects from the City’s now $12.3 billion annual city budget, taxpayers might not now be on the hook for what is approaching $1.75 billion in Affordable Housing Bond debt. This is important precisely because of the growing calls to issue even more Affordable Housing bonds every four to five years going forward.
 “Failure to Build” ≠ “Equity”
Leading up to placing the $600 million Affordable Housing Bond on the November 2019 ballot, a new word cropped up. Not the word “P” for “Pool” about River City, Iowa in the song “Ya Got Trouble” in the musical, The Music Man.
No, the new buzz word isn’t “pool.” It’s “equity,” which MOHCD rolled out as a new tag line between March and June 2019 that reads: “Funding Housing Equity in San Francisco.”
There’s a lot of new talk about equity for seniors, equity for teachers and educators, equity for the homeless, equity for homeless transitional-age youth, equity for veterans, equity for low-income households, equity in the number of units constructed with two- or three-bedrooms to accommodate families, and equity for housing developments in underserved neighborhoods.
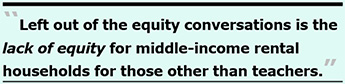
Back in reality land, left out of the equity conversations is the lack of equity for middle-income rental households for those other than teachers.
 When MOHCD’s then director, Kate Hartley, blurted out on July 11 that the City has “failed to build affordable middle-income housing,” it was galling on a number of levels.
First, Hartley made matters much worse when she opened her moth and inserted her foot even further, adding:
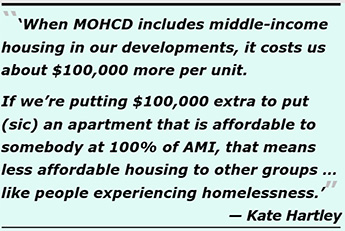
“When MOHCD includes middle-income housing in our developments, it costs us about $100,000 more per unit because we can’t access federal and state funds for those apartments, and so we have those cost constraints that really are important to consider.
If we’re putting $100,000 extra to put (sic) an apartment that is affordable to somebody at 100% of AMI, or 120% of AMI, then that means less affordable housing to other groups of people who are desperately in need, like people experiencing homelessness” [Emphasis added].
 There you have it: MOHCD is not interested in spending $100,000 more for any middle-income housing units (other than for educators), because it would negatively affect people with desperate needs, like those who are homeless. In effect, Hartley was pitting middle-income households against those experiencing homelessness, or holding middle-income households’ hostage to the homeless.
God forbid taking funding away from people who are homeless just to achieve middle-income housing equity, or parity, in funding. Is this hubris run rampant?
On January 28, 2016 Hartley informed CGOBOC members “most of our [MOHCD’s] developments have a set-aside of 20% of the units for formerly, chronically homeless individuals.”
Does that mean that the homeless are earning double “equity”?
 The $100,000 more per middle-income unit deserves a closer look. Consider the elimination of the two affordable middle-income rental programs that were to produce 235 units.
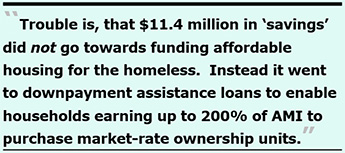
Only 121 of the 235 planned middle-income rental units were kept (82 units for teachers, and 39 for non-teachers). That suggests MOHCD may have spent $12.1 million (at $100,000 each, per Hartley) to keep those 121 units. But MOHCD eliminated 114 middle-income rental units, in effect “saving” $11.4 million (at $100,000 each). Trouble is, that $11.4 million in “savings” did not go towards funding affordable housing for the homeless. Instead it went to downpayment assistance loans to enable households earning up to 200% of AMI to purchase market-rate ownership units.
 Second, Hartley must have known that when Time magazine inter-viewed then-Mayor Lee five-and-a-half years ago in January 2014, they had asked him why San Francisco had been so slow to build housing. In addition to Lee replying “I don’t think we paid any attention to the middle class. I think everybody assumed the middle class was moving out,” as I’ve previously reported, Lee also admitted:
“Our city did pretty good in investing in low-income housing and trying to do as much as we could for the homeless. That was where our sentiments were.”
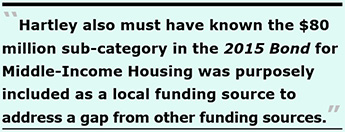
Third, Hartley also must have known that the $80 million sub-category in the 2015 Bond for Middle-Income Housing was purposely included to address a gap from other funding sources, because there are no state or federal funding sources for middle-income housing. Hartley had to know San Francisco had taken the lead in carving out the dedicated $80 million as a local source of funding subsidy for middle-income housing, since Hartley’s MOHCD January 2016 report to CGOBOC specifically stated:
 “The need is particularly acute for moderate-income households, for whom there is no federal or state financing programs (such as low-income housing tax credits, which cap eligibility at 60% of AMI) that the City can leverage with its own subsidies.”
The report also noted that the Middle-Income Rental Program stipulated in the legal text of the 2015 Bond stated:
“Bond funds may be allocated to support the creation of permanently affordable rental units designated for middle-income households that are currently not served by the City’s traditional affordable housing programs.”
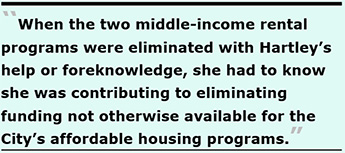 Finally, Hartley had to know that $42 million initially included across two middle-income rental programs in the Middle-Income Housing sub-category were eliminated from bond spending by July 2016 under her leadership, including the Middle-Income Rental Program explicitly named in the legal text of the 2015 Bond and named in the formal question put before voters on the November 2015 ballot. When the two middle-income rental programs were eliminated with Hartley’s help or foreknowledge, she had to know she was contributing to eliminating funding not otherwise available for the City’s affordable housing programs that have no other federal or state financing support.
39 Units ≠ Middle-Income Housing Equity
Just 11 days after the Board of Supervisors Rules Committee hearing on July 11, news surfaced on July 22, 2019 that Kate Hartley was suddenly stepping down as MOHCD’s director. Somewhat ironically, that news surfaced on the same day that MOHCD presented a new report to the Capital Planning Committee regarding issuing the third $92.8 million tranche of the $310 million 2015 Bond. The report cover carried a new tag line that read “Funding Housing Equity in San Francisco.” However inadvertently, the tag line was laced with unintended irony.
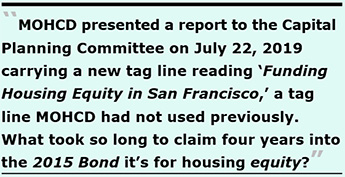 MOHCD then piled on, issuing its June 2019 quarterly report on the 2015 Bond to CGOBOC in early August, again repeating the new tag line about funding housing equity, a tag line MOHCD had not used on its March 2019 report, or previously. What took so long to claim four years into the 2015 Bond it’s for housing equity?
The noun equity has two meanings: One is “valuation,” for the worth of an investment, or market value of real property, as in she owns 25% of the home’s equity. The other is “fairness,” as in equity of treatment or fair balance.
The Middle-Income Housing category of the 2015 Bond does provide some market value, in that the $39.4 million reserved for DALP and TND ownership loans does provide equity for market-rate homebuyers who will reap significant appreciation when they resell their properties, and the City’s share of the appreciation will yield equity to the City.
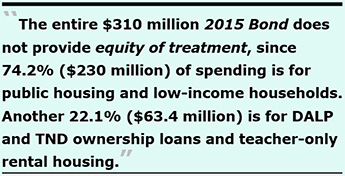 The entire $310 million 2015 Bond does not provide equity of treatment, since 74.2% ($230 million) of spending is for public housing and low-income households. Another 22.1% ($63.4 million) is for DALP and TND ownership loans and teacher-only rental housing. Just 3.2% ($10 million) is for non-teacher rentals. That’s not equity for non-teacher middle-income rental households.
And 85.6% ($68.5 million) of the $80 million Middle-Income Housing subcategory in the 2015 Bond is earmarked for ownership loans ($39.4 million), and for teacher and educator rental housing at the Francis Scott Key Annex site ($29 million). As Table 2 above shows, just $10 million — 3.2% of the 2015 Bond — will fund a mere 39 rental units for non-teachers at two projects (88 Broadway Street and 482 Geneva Avenue).
The 39 middle-income non-teacher housing units represent 2.6% of the total 1,501 projected housing units MOHCD reported to CGOBOC in March 2019. Alternatively, the 39 units represent 3.9% of the 1,003 projected units shown in Table 1 above by eliminating the 445 infrastructure-only “units” that are either pre-development or infrastructure expenses in the Public Housing category and whose vertical construction is from other non-Bond funding sources.
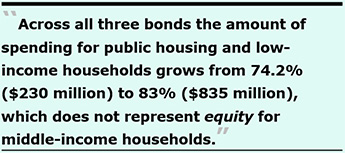 Across all three bonds (1996 Bond, 2015 Bond, and if passed the 2019 Bond) the amount of spending for public housing and low-income households grows from 74.2% ($230 million) to 83% ($835 million), which proponents of the bond and MOHCD can’t claim with a straight face represents housing equity for middle-income households.
Also across all three bonds, the $10 million for just 39 middle-income rental units for non-teachers earning between 80% to 120% of AMI represents just 1% of the $1.01 billion in total bonds.
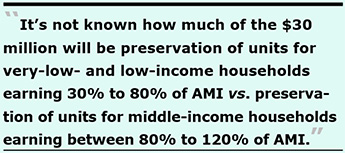
Although the proposed 2019 Bond includes a $30 million category for Affordable Housing Preservation expected to produce a total of 90 units, that category is for households earning 30% to 120% of AMI. It’s not known how much of the $30 million will be preservation of units for very-low-income and low-income households earning 30% to 80% of AMI vs. preservation of units for middle-income households earning between 80% to 120% of AMI.
 The proposed $600 million 2019 Bond makes a lot of noise about creating “equity” for neighborhoods and populations for which there has been “limited affordable housing production,” but the Bond totally ignores creating equity for middle-income households facing the same limited affordable housing production.
Ignoring RHNA Targets ≠ Middle-Income Housing Equity
Also galling is the Affordable Housing Bonds continue to ignore prioritizing RHNA recommendations.
MOHCD’s December 2018 report to CGOBOC claimed:
“Further, through prioritized spending, the 2015 Housing Bond will help the City to provide housing for the specific income categories identified in the Regional Housing Needs Assessment (RHNA) [reports].”
 At the time the City was developing planned funding allocations for the 2015 Bond, Table 5 illustrates that MOHCD had to have known Mayor Lee had been right in January 2014 saying the City had produced:
Table 5: RHNA Targets vs. Housing Units Produced, 2007–2014
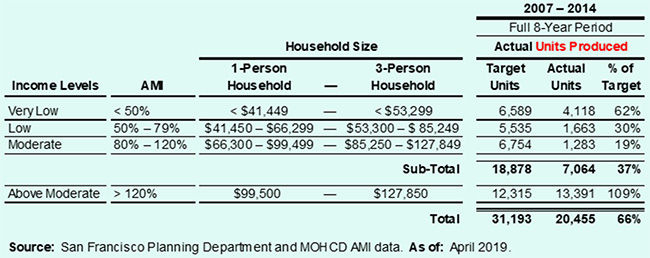
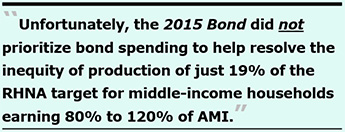 Unfortunately, Table 5 also illustrates the 2015 Bond did not prioritize bond spending to help resolve the inequity of production of just 19% of the RHNA target for middle-income households earning 80% to 120% of AMI.
As Table 2 showed earlier, just 3.2% ($10 million) of the $310 million 2015 Bond was for non-teacher middle-income rental housing, 12.7% ($39.4 million) of the bond was for market-rate ownership downpayment loans for households earning up to 200% of AMI, 9.4% ($29 million) was for teacher-only housing for households earning up to 140% of AMI, and fully 74.2% ($230 million) was for public housing and low-income housing units for households earning less than 80% of AMI.
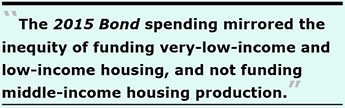 The 2015 Bond spending mirrored the inequity of funding very-low-income and low-income housing production, and not funding middle-income housing production.
Looking back further at equity related to RHNA goals prior to the 2015 Bond, the picture is even bleaker according to Planning Department data.
Figure 3: 18-Year Dearth of Moderate-Income Housing Production
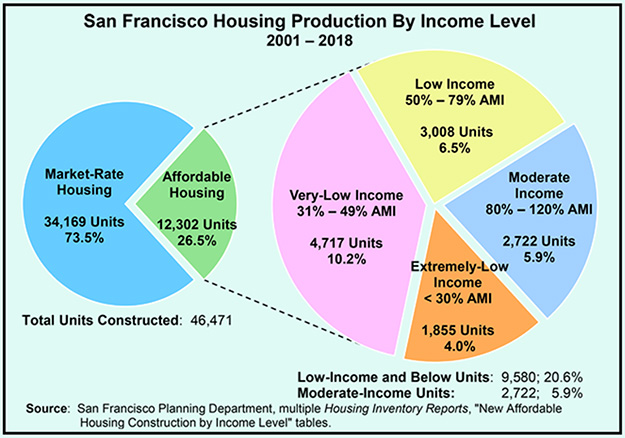
 Looking closely at Figure 3, of the 46,471 housing units constructed in San Francisco between 2001 and 2018, 73.5% percent was for constructing 34,169 market-rate housing units. All other household income levels split the remaining 26.5%, producing just 12,302 units. The 2,722 Moderate-Income units produced during that 18-year period represent 22% of the total 12,302 Affordable Housing units produced, but represent just 5.9% of the 46,471 total units.
The remaining 9,580 of 12,302 Affordable Housing units (78%) were for households in the low-income and below categories, representing just 20.6% of the 46,471 total units.
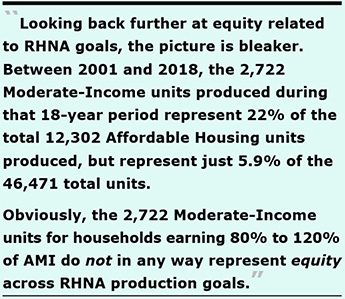
Obviously, the 2,722 Moderate-Income units for households earning 80% to 120% of AMI do not in any way represent equity across RHNA production goals.
Ignoring Vulnerable Populations ≠ Low-Income Housing Equity
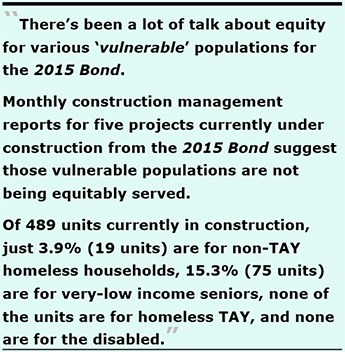
During the three-and-a-half years since CGOBOC held its first hearing in January 2016 on the 2015 Bond, there has been a lot of talk about equity for various “vulnerable” populations, including homeless transitional-age youth (TAY), veterans, seniors, non-TAY homeless people, the disabled, and others.
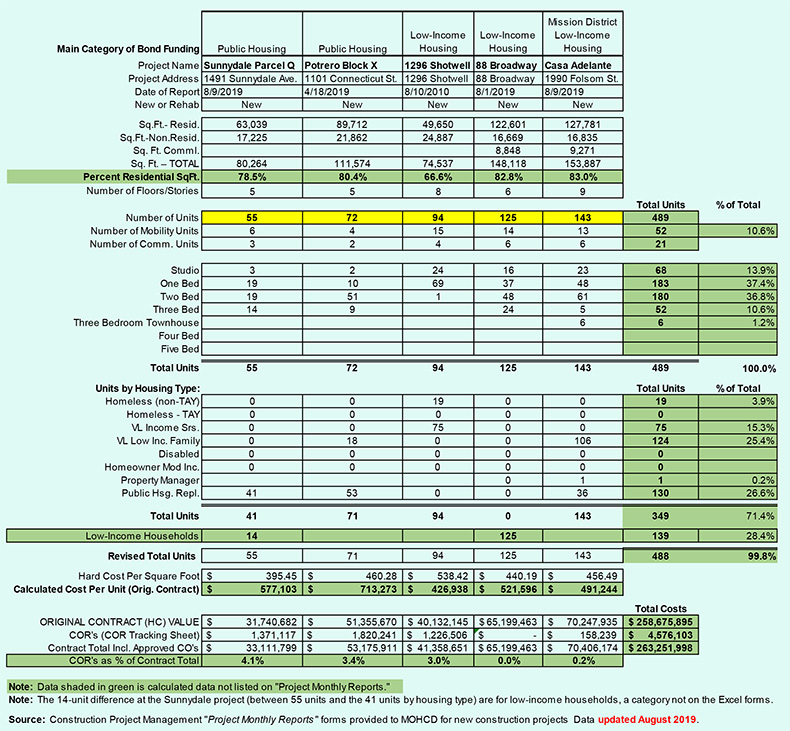
 But monthly construction management reports as of August 2019 submitted to MOHCD for five projects currently under construction from the 2015 Bond suggest those vulnerable populations are not being equitably served from the Bond. The monthly reports only include data for a handful of various vulnerable populations, and surprisingly don’t include veterans.
Table 6 illustrates that of 489 units currently in construction across the five projects, just 3.9% (19 units) are for non-TAY homeless households, 15.3% (75 units) are for very-low income seniors, none of the units are for homeless TAY, and none are for the disabled [although 10.6% (52 units) are classified as “mobility units” for people with a mobility disability, perhaps due to ADA requirements in the planning code, or perhaps due to ADA requirements for low-income housing tax credit financing].
Why there is a category in the monthly reports for “Public Housing Replacement” (PHR) units in what was thought to be a list of vulnerable populations isn’t known. [PHR units involve construction of new affordable apartments to replace old Public Housing apartments that are obsolete and demolished. The PHR units were not initially identified by CGOBOC as a “vulnerable” population category.]
As a reminder, there was a total loss of 109 units for seniors funded by the Bond between when the 1296 Shotwell project replaced the 250 Laguna Honda Boulevard project, plus Bond de-funding of the planned senior units at 735 Davis Street.
Table 6: Monthly Construction Management Reports 2015 Bond Projects in Construction
 Also, regarding Table 6:
Housing Lotteries ≠ Equity
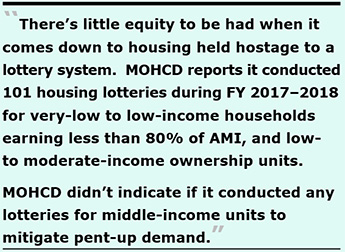 There’s little equity to be had when it comes down to housing held hostage to a lottery system. The need for affordable housing is demonstrated by housing lotteries MOHCD conducted during Fiscal Year 2017–2018 ending June 30, 2018. MOHCD’s Annual Progress Report 2017–2018 reports MOHCD conducted 101 housing lotteries for 490 “affordable” homes, including 399 rental units for very-low to low-income households earning less than 80% of AMI. The other 91 homes were for low- to moderate-income ownership (not rental) units.
There were 42,364 applications for the 399 rental units — averaging 106 applications per unit — despite the City’s focus on funding low-income housing. Unfortunately, MOHCD didn’t indicate whether it conducted any lotteries for middle-income units to mitigate pent-up demand.
Some wonder if the lotteries are only for very-low- to low-income households, whether there’s any equity for middle-income households to be had.
Who Are “Failed” and Left Behind: Vote “No” on Prop. A
 It’s painfully clear that the previous Affordable Housing Bonds have not prioritized funding middle-income housing! That may not be why Supervisor Fewer had asked rhetorically on July 11 multiple times, “Who are we leaving behind?”
That’s when MOHCD’s then-director, Kate Hartley, blurted out replying to Fewer July 11 that the City has “failed to build affordable middle-income housing,” and then went on to claim that spending $100,000 more for a middle-income housing unit would negatively affect people like those who are homeless. Hartley testified:
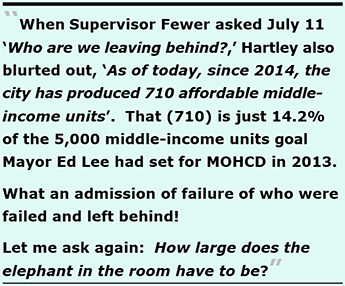
“Unfortunately, the 5,000 unit middle-income [housing production] goal that [Mayor Ed Lee] charged us with [in 2013 to meet by 2020], we are not anywhere close. As of today, since 2014, the city has produced 710 affordable middle-income units, 710.”
The 710 units represent just 14.2% of Lee’s 5,000 middle-income units goal. What an admission of failure and who were failed, and continue being left behind! Let me ask again: How large does the elephant in the room have to be?
As the Westside Observer has reported since 2016, when CGOBOC held its inaugural hearing on the 2015 Affordable Housing Bond in January 2016 several CGOBOC members, including member Brenda Kwee McNulty, fretted on January 28, 2016 about the lack of metrics to evaluate bond spending. During the discussion about developing metrics, McNulty astutely noted:
“But I think it’s helpful to be able to at this early stage of the game [to] lay out those areas, or categories of returns … so that we can go back [later to] evaluate how successful ... what our return was for the whole bond program. So, the relative returns of these categories will also shed some light into whether or not we made the right allocation decisions.”
 Now three-and-a-half years following passage of the 2015 Bond, CGOBOC hasn’t discussed whether the right allocation decisions had been made, or who were left behind and failed by the Bond.
The elephant in the room that Supervisor Sandra Lee Fewer and MOHCD are ignoring is that middle-income rental housing production is being left behind, and failed, unless you are a teacher eligible for the Francis Scott Key Annex project.
It’s sad that MOHCD is unwilling to spending $100,000 more for middle-income housing units because doing so may impact production of housing for the homeless, pitting one group against another for scarce resources.
 It’s even sadder that Fewer, the Board of Supervisors, and MOHCD may all be suffering from “optimism bias,” overly-optimistic about positive impacts of the $600 million 2019 Affordable Housing Bond, and totally under-estimating the likelihood of continuing negative impacts resulting from not funding middle-income rental housing other than for teachers.
Strike one was underperformance of the 1996 Bond. Strike two was underperformance of the 2015 Bond. Voting to pass the 2019 Bond may be the City’s and MOHCD’s “Strike three, you’re out!”
Considering the City’s poor performance with the $310 million 2015 Affordable Housing Bond, why should voters reward them by nearly doubling another housing bond to $600 million?
 Given multiple problems described in this article, Vote “No” on the Prop. “A” Affordable Housing Bond in November.
Monette-Shaw is a columnist for San Francisco’s Westside Observer newspaper, and a member of the California First Amendment Coalition (FAC) and the ACLU. He operates stopLHHdownsize.com. Contact him at monette-shaw@westsideobserver.com.
1 Definition of tranche: “A division or portion of a pool or whole; specifically: An issue of bonds derived from a pooling of like obligations (as securitized mortgage debt) that is differentiated from other issues especially by maturity or rate of return.”