 Article in Print Printer-friendly PDF file
Westside Observer Newspaper
May 2017 at www.WestsideObserver.com
Remembering Laguna Honda Hospital’s Sister Miriam Walsh
Where’s Our Torchbearer for the Elderly?
Article in Print Printer-friendly PDF file
Westside Observer
Newspaper
May 2017 at www.WestsideObserver.com
Remembering Laguna Honda Hospital’s Sister Miriam Walsh
Where’s Our Torchbearer for the Elderly?
by Patrick Monette-Shaw
Elderly San Franciscans are in dire need of a new torchbearer.
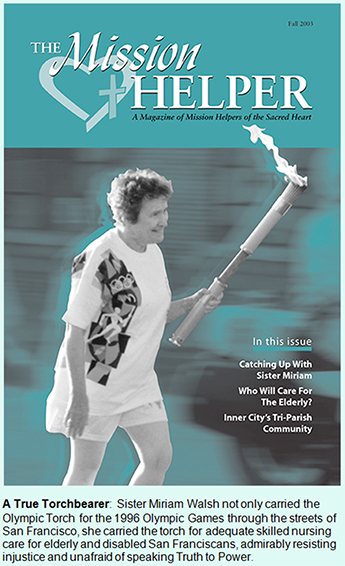
Sister Miriam Walsh, our beloved friend and Laguna Honda Hospital’s Director of Pastoral Care for nearly 30 years, passed away December 3, 2009 following an extended illness in Baltimore, Maryland just a year after she retired. She was 82.
As the Westside Observer reported in “Laguna Honda’s Torchbearer, Sister Miriam Walsh” in February 2010, a Laguna Honda resident nominated Sister’s name to the 1996 Olympic Torch Relay Committee as someone who had given generously to the community, and she was chosen to help carry the 1996 Olympic torch through the streets of San Francisco.
Many still view Sister Miriam as the Mother Teresa of Laguna Honda Hospital. She would most likely have demurred from the comparison.
Sister Miriam believed fiercely that our society has a special obligation to care for the elderly and disabled. She was deeply moved when Pope John Paul II declared in his Lenten message in 2005 that caring for the elderly was an ethical priority.
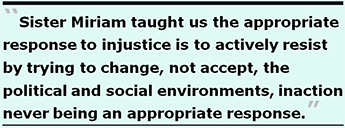
Sister Miriam taught us that the appropriate response to injustice is to actively resist by trying to change, not accept, the political and social environments, inaction never being an appropriate response to injustice. She was way ahead of her time and current resistance efforts against Donald Trump’s presidential administration, being a torchbearer of resistance.
Just after Laguna Honda’s former Executive Administrator, John Kanaley, was appointed in 2004 he summoned Sister Miriam to his office. She gleefully reported afterward — twinkles in her Irish eyes — that “Kanaley wanted me to agree to a deal to keep Laguna Honda’s name out of the media and wanted me to pipe down. I told him, ‘No deal,’ and that was the end of the meeting.” Sister Miriam was never intimidated by the “powers that be,” actively resisting.
 Shamefully, after nearly three decades of dedicated public service to Laguna Honda residents, noticeably absent from her memorial service held on December 16, 2010 at Laguna Honda were Laguna Honda’s current Executive Administrator Mivic Hirose, then-Director of Public Health Mitch Katz, then-District 7 Supervisor Sean Elsbernd, and then-Mayor Gavin Newsom. Sister Miriam had actively and strongly resisted each of them to protect skilled nursing care for elderly San Franciscans she cared for so deeply.
Sister would be appalled by the current state of affairs in our City of Saint Francis. Now seven-and-a-half years following her death, we desperately need a new torchbearer for the elderly.
 There are a number of trends that would have alarmed Sister Miriam greatly, ranging from out-of-county patient dumping, to the number of re-admissions to acute-care hospitals following discharge from Laguna Honda Hospital and San Francisco General Hospital and perhaps other private-sector San Francisco hospitals, and client satisfaction survey data.
Disturbing Trends
Watch out. Something continues to not be right here, and hasn’t been since at least 2003. Then-director of the Department of Public Health, Mitch Katz, launched a misguided attempt to convert Laguna Honda Hospital into a “psychosocial rehabilitation center for the urban poor” by instituting a “flow project” to divert the flow of patients being discharged from San Francisco General Hospital into LHH. Katz’s botched plan was eventually halted by then-Mayor Gavin Newsom and then-District 7 Supervisor Sean Elsbernd.
 The November 2004 edition of the West Portal Monthly newspaper — the precursor to the current Westside Observer newspaper — published a letter-to-the-editor written by Dr. Maria Rivero, the then-attending physician on LHH’s Admitting Ward. Rivero wrote, in part:
“In March of 2004, the admissions policy of LHH was changed over the strong objections of doctors who were concerned about patient safety. This change was part of a plan by the Department of Public Health to transform the identity of the hospital.
Instead of caring primarily for the elderly and disabled poor of San Francisco, Dr. Mitchell Katz, the Director of [Public] Health, wants Laguna Honda to do ‘social rehabilitation for the urban poor.’
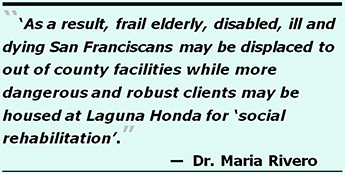
As a result, frail elderly, disabled, ill and dying San Franciscans may be displaced to out of county facilities while more dangerous and robust clients may be housed at Laguna Honda for ‘social rehabilitation’.”
Matters have worsened since 2004, that dismayed Sister Miriam even back then.
 Laguna Honda Demographics Changes: Gender
Since 2005, Laguna Honda Hospital has been required to submit quarterly reports to the Board of Supervisors documenting a variety of patient demographics following the disastrous “flow project” of 2003–2004.
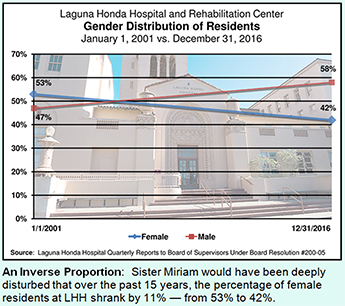
Comparing data from the May 27, 2010 quarterly report submitted to the Board of Supervisors to the February 9, 2017 quarterly report illustrates that there has been a statistically-significant 11% inverted shift in genders of patients admitted to LHH since 2001. Across those 15 years, LHH’s female residents dropped from 53% to 42%, while male residents increased from 47% to 58%.
For over two decades, this author has been dismayed by continuing efforts of the Department of Public Health to hide the significance of data by reporting only percentages, rather than including raw numbers to flesh out what the data represents.
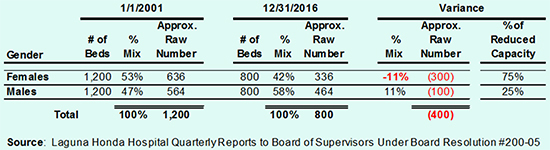
Table 1 below extrapolates the percentages of the genders of LHH admissions to the approximate number of beds in the hospital before and after the facility was downsized from approximately 1,200 beds to 800 beds. The data in each of the quarterly reports appear to be percentage snapshots on given dates, not the total number of patients throughout an entire calendar year. That portends that throughout a given calendar year, the number of patients impacted is much, much higher, given patient turnover.
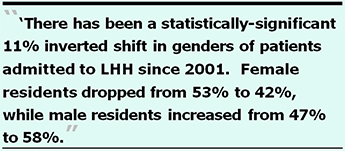 Table 1 illustrates that 300 fewer female patients were LHH residents on December 31, 2016 as compared to January 1, 2001, and represent 75% of the lost 400 beds. [Note: The number of beds and extrapolated data are rough estimates of raw numbers.] That female residents dropped by 300 — or more throughout an entire calendar year — would have been of deep concern to Sister Miriam.
Table 1: Gender Distribution of LHH Residents
Laguna Honda Demographics Changes: Age
 According to a Family Caregiver Alliance (FCA) report published January 31, 2015, most — but not all — persons in need of long-term care are elderly. FCA noted approximately 63% of people needing long-term care are age 65 or older.
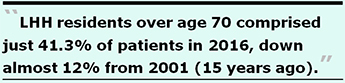
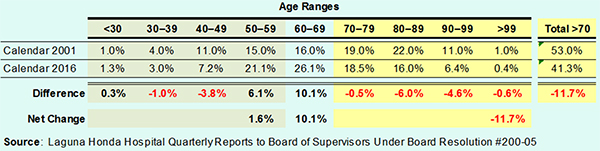
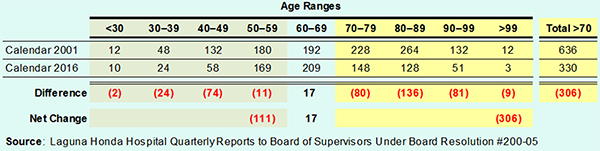
Table 2-A reports the percentages listed in the two quarterly reports to the Board of Supervisors, showing LHH residents — formerly a long-term care facility — over the age of 70 comprised just 41.3% of patients in 2016, down almost 12% from 2001 (15 years ago), which would also have been of deep concern to Sister Miriam
Table 2-A: Age Distribution of LHH Residents (Percentages)
 Again, because the Department of Public Health and LHH only report percentages, Table 2-B below extrapolates percentages in Table 2-A to the approximate number of beds in the hospital, using 1,200 beds for Calendar 2001 and 800 beds for Calendar Year 2016. The extrapolated raw numbers present a very rough estimate, but illustrate the elderly have been impacted the most with approximately 306 fewer residents over the age of 70.
Table 2-B: Age Distribution of LHH Residents (Raw Numbers)
Out-of-County Patient Dumping
 As the Westside Observer reported last March, between July 1, 2012 and December 31, 2016 our two county hospitals — Laguna Honda Hospital and SFGH — have discharged at least 260 patients out-of-county, as shown in Table 3 below.
The Department of Public Health has refused to honestly report the number of additional LHH out-of-county discharges that occurred between July 1, 2006 and June 30, 2012, even though more than likely it has this historical data and despite having been repeatedly pressed to release the data. Sister Miriam would likely have found this to be deeply disturbing, and an unethical response to injustice. She probably would have demanded DPH report these statistics honestly.
Table 3: Out-of-County Patient Discharges Four-and-a-Half Fiscal Years
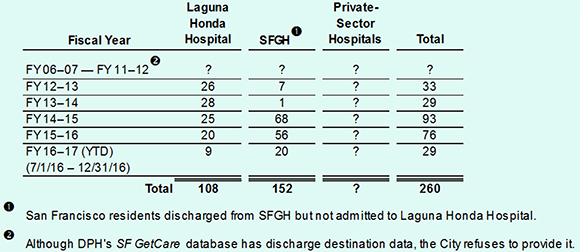
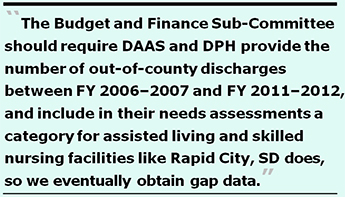 The City — between DAAS and DPH — has paid at least $7.8 million between July 1, 2002 and April 10, 2017 to develop over a dozen different components of the SFGetCare database. It is thought SFGetCare probably has data fields tracking how many people were diverted from admission to LHH, as well as, most likely, the discharge destination (in-county and out-of-county) of patients discharged from LHH and SFGH in order to facilitate post-discharge follow-up. Given the probable availability of this data, the City should require that DAAS and DPH provide the number of patients discharged out-of-county during the six fiscal years between FY 2006–2007 and FY 2011–2012 not shown in Table 3 above.
In addition to the patient dumping out-of-county from our two county hospitals, it isn’t known how many additional out-of-county discharges have been made by other San Francisco private-sector hospitals, skilled nursing facilities, and assisted-living facilities during the same timeframe. This, too, would have also deeply saddened Sister Miriam, since it also affects other step-down post-acute care facilities, and the on-going shrinkage of board-and-care facilities in-county.
Long-Term Care Coordinating Council and Community Living Fund
 In November 2004, then-Mayor Gavin Newsom created a 41-member Long-Term Care Coordinating Council (LTCCC) to generate policy guidance to the Mayor’s Office and City agencies. The LTCCC was charged with facilitating improved coordination of home, community-based, and institutional services for older adults and adults with disabilities.
Two years and three months later, the LTCCC pushed the City into launching a program called the “Community Living Fund” (CLF) in February 2007. While the CLF claims it is principally focused on providing community-based services, in reality it is more focused on providing “case management” by social workers, and less so on providing actual services.
The CLF was created to fund “community placement alternatives, including programs and services provided in an individual’s home, programs and services provided in assisted living facilities, supportive housing and, congregate housing; and to provide care and support for individuals who may otherwise require care within an institution.” Top priority was to have been given to residents of LHH, and SFGH patients being diverted from admission to LHH. Additional priority was to be given to those facing nursing home admission to continue residing in San Francisco. Unfortunately as the out-of-county discharge data above shows, rather than helping people continue residing in the City, many have simply been dumped out-of-county.
 From the outset, the LTCCC has displayed outright hostility to funding institutional settings such as LHH, and over the years has done nothing to protect or advocate for elderly and disabled people who may prefer nursing home placement rather than community-based services.
Over its first three years, the CLF had been awarded $10 million by FY 2008–2009 but had left 50% of that unspent, carrying forward unencumbered funds from year to year. As testimony presented to the Board of Supervisors Budget and Finance Committee on June 27, 2009 shows, then-Mayor Newsom set out to raid $1 million from the CLF’s then unspent balance in order to balance his City budget, in addition to having cut $1 million from the Health at Home program. During the LTCCC’s June 11, 2009 meeting, Catherine Dodd — then-Deputy Chief of Staff for Health and Human Services to Newsom — announced Newsom had taken $1 million from the then-unspent $5 million CLF balance to balance his FY 2009–2010 City budget.
 The Department of Aging and Adult Services FY 2016–2017 budget grew the CLF’s allocation to $8.1 million, up from the initial $3 million the CLF was first awarded when it was created in 2007. What’s it doing with all those millions?
Community Living Fund Client Satisfaction Survey Data
The most-recently released CLF Client Satisfaction Survey conducted by the Institute on Aging (IOA) is from June 2015 measuring CLF-funded services. It was included as an attachment to a six-month report to the Board of Supervisors on September 29, 2015 for the reporting period January – June 2015. It’s not known whether it has been updated since.
 The Telephone Interview and Mail Survey sample started with 178 CLF clients, even though elsewhere it was reported the CLF program at the IOA then reportedly had 256 clients. Why 78 of the 256 clients were excluded from the survey pool wasn’t explained. DAAS claimed it had a 74% response rate, but appears to only have included 60 completed or partially-completed interviews. This may be the “new math.” When I learned math, if 60 people completed an interview from a pool of 178 clients, I was taught that represented a response rate of just 34% — just over one-third — not 74%.
Of note, Chart 2 in the published analysis shows the number of calls it took to reach each client totaled only 174 clients, four short of the 178 clients. And data in Table 1 in the survey analysis reporting on the outcomes of the phone calls totaled only 177 clients, one short of the 178. Why the data in Chart 1 and Table 1 in the telephone survey didn’t match the 178 CLF client total is symptomatic of sloppy reporting of data. DAAS appears to have restricted the sample size and reported response rates in several ways.
 Table 1 in the Satisfaction Survey results categorized just 60 clients as “completed interview” (including two “Incomplete Interviews” that may have been partially completed) as the numerator, and 21 were classified as “Non-Interviewed Eligible Respondents” for a total of 81 survey participants as the denominator, to calculate the 74% response rate. But in the “old math,” 81 clients who were either reached and completed the phone interview or were reached but classified as “non-interviewed” equals a response rate of just 46% of the 178 CLF clients. DAAS appears to have used the “throw sand in the eyes of a bull” strategy to interpret the response rate dilemma using the technique Robert Pirsig discussed in his classic philosophical non-fiction book “Zen and the Art of Motorcycle Maintenance” in 1974.
DAAS chose to present data only on 81 clients, not the full CLF client case load. It is thought that the survey response data summarized below is only from the 60 CLF clients who actually participated in the initial phone survey.
 DAAS indicated it had excluded from survey results seven categories of calls (wrong number, business numbers, deceased clients, clients too ill to do a phone interview, clients with language barriers, no phone number, and disconnected phone numbers) from the denominator. That eliminated at least 43 clients (or perhaps more, because DAAS didn’t include in Table 1 a “deceased” category or raw number). In addition, DAAS excluded another six categories of calls without any explanation (including fax numbers, phone numbers “not in service,” an unexplained “other” category, clients who had not received CLF services in a long time, clients whose services had not yet started, and a whopping number of clients who could not be reached after the 10-call maximum limit). That eliminated another 53 clients.
Combined, the explained and unexplained clients eliminated from the survey pool totaled 96 (54%) of the CLF’s 178 clients. That’s a lot of clients lost to follow-up. And of note, of the 21 clients who were classified as “Non-Interviewed Eligible Respondents,” nine (43%) were either “hard refusals” or “soft refusals” to participate in the phone survey (the distinction between the two types of refusals left unexplained). To be generous, the nine refusals to participate represent 11% of the 81 of the clients who either participated or were categorized as “non-interviewed.”
 Because only 60 CLF clients actually took part in the satisfaction survey, it may explain why DAAS chose to report percentages of responses to each of the survey questions asked, not raw numbers, to obscure how many responses it had actually received, and obscure how many clients had died while in the CLF program.
That said, the Survey data results paint a disturbing picture. Of the apparent 60 CLF clients who responded to the survey:
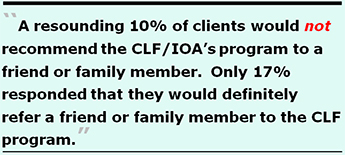 7% said that the services they received did not help them maintain or improve their quality of life, while 69% indicated services they received had helped “to some extent” them maintain or improve their quality of life. And just 21% said that the services they received had helped them maintain or improve their quality of life.
Overall, the client satisfaction survey results do not seem to be a ringing endorsement of the CLF’s, or IOA’s, services.
CLF Budget and Expenditures
 One reason CLF clients may have provided underwhelming endorsements of the CLF/IOA’s services may be due in large measure to CLF budget expenditures since the program was implemented in February 2007. In addition to the CLF quarterly reports discussed below, the CLF six-month report for the period January–June 2016 (dated November 2, 2016) contains data of concern regarding CLF’s budget.
For starters, on page 3-1 in that report (page 11 in the PDF file) the total budget between its inception and June 30, 2016 was reported to have been $35.5 million. (That figure probably grew by another $4.8 million for FY 2016–2017 ending June 30, 2017 to a revised total of $40.3 million.) But the chart showed total expenditures since inception was only $33.1 million. No explanation was provided to clarify the $2.4 million gap between the total budget and total expenditures. Where did that $2.4 million go?
 Page 3-1 reported $25.6 of the $33.1 million was for IOA-contracted expenditures for CLF clients, while the $7.5 million balance went to various contractors, and salaries and fringe benefits of DAAS employees.
Of the $33.1 million in CLF expenses from inception through June 30, 2016, just $10.7 million (32.3%) went to “Purchase of Services” for CLF clients. A whopping $10.5 million (31.6%) went for case managers (social workers), and another $3.4 million (10.2%) went to DAAS employee salaries and fringe benefits for 74% of the $33.1 million in expenditures across these three categories. Another $3.2 million (9.6%) was spent on “Operations,” (presumably operating expenses of some sort).
 Of the $10.7 million that trickled down since inception to “Purchase of Services” for actual CLF clients, the data is more troubling. Page 4-1 of the report (page 12 in the PDF file) noted that of 1,099 clients who have received purchased services since inception of the CLF program, just 241 have received home care services (presumably for home health aides and other in-home care), and only 59 have reportedly received funding to support living in a board & care facility. Those two categories represented $7.9 million of the $10.7 million, leaving clients relying on 15 other categories of purchased services to vie for the remaining $2.7 million — for such things as adult day programs, transportation, assistive devices, non-medical home equipment, and general rental assistance to help them remain living in the community.
It’s worth repeating that $10.5 million went for case managers, and a nearly equal $10.7 million went for actual purchase of services for CLF clients. Why did clients need so much “management” of their cases via social workers?
 Since so little has trickled down, it’s no wonder just 21% of the 60 survey respondents reported that the services they received had helped them maintain or improve their quality of life, and only 17% said services they had received had helped them stay in their home.
At the risk of sounding picky, another concern is that the report noted on page 1-1 (page 6 in the PDF file) that as of June 30, 2015, of the then-256 CLF clients at the IOA, just 118 (46%) needed to purchase CLF services, while 138 (56%) needed to purchase no services. As of June 30, 2016, of the then-291 CLF clients at the IOA, 145 (46%) needed to purchase CLF services, while 146 (50%) needed to purchase no services. Why do so many IOA/CLF clients not need to purchase CLF services, and why are they CLF clients? Because they simply need a case manager/social worker?
CLF Quarterly Reports
 Like LHH, the CLF is also required to provide reports — but only every six months, rather than quarterly — on various data to the Board of Supervisors. The last four CLF six-month reports aren’t too encouraging.
For starters, the six-month reports don’t provide any data on the raw numbers of people discharged from LHH, or the number of those diverted from admission to LHH, who eventually received assistance from the CLF, to assess how many of the discharged or diverted patients actually needed support services from the CLF. So there’s no accurate way of knowing whether the CLF fund is actually helping the very patient population it was created to serve. Since the SFGetCare database more than likely has data on how many patients need the CLF, it should be publicly reported to help assess the efficacy of the Community Living Fund’s performance, and to learn the source of referrals to the CLF.
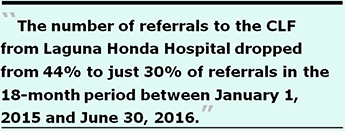 What is known from the last three six-month reports across an 18-month period is that the number of referrals to the CLF from Laguna Honda Hospital — in the absence of knowing how many total discharges or diversions there had been — dropped from 44% to just 30% of referrals between January 1, 2015 and June 30, 2016. That’s another statistically-significant 14% decline, but no information was provided about why so many fewer LHH residents being discharged were referred to the CLF.
Of note, the July–December 2014 six-month report noted that lack of housing is the primary barrier to discharge from skilled nursing facilities, so the CLF began limiting assistance to only residents with existing housing. That’s comical, because discharge planners at LHH have known since at least 2005 that the most-significant barrier to discharge is the lack of housing. What took the CLF so long to figure out what LHH clinicians had known all that time?
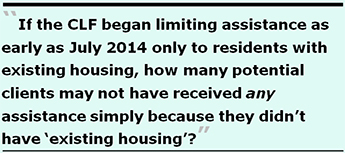 One concerning question is that if the CLF began limiting assistance as early as July 2014 only to those with existing housing, how many potential clients may not have received any assistance, simply because they didn’t have “existing housing”?
In its July–December 2015 six-month report dated May 4, 2016 indicated that a new “Post-Acute Care Project” would identify the number of long-term skilled nursing facility residents who could transition to lower levels of care in the community. That’s also comical, because the Mayor’s LTCCC was charged at its creation in 2007 with identifying the same number of skilled nursing residents who could transition to lower levels of care in the community. After eight to nine years, have the LTCCC, DAAS, and the Department of Public Health still been unable to calculate that number?
Re-Admission to Acute-Care Hospitals
 Hospital re-admissions are associated with unfavorable patient outcomes and high costs. To lower the rate of re-admissions, hospitals and other healthcare providers focus on coordination of care; on improving communications between providers, patients, and caregivers; and on improving discharge planning and follow-up of discharged patients.
In 2015, DAAS may have again contracted with RTZ Associates to enhance the CLF database (thought to be a component of the SFGetCare database developed by RTZ) to increase data collection of new performance measures, including the percent of CLF clients with one or fewer admissions to an acute-care hospital within a six-month period.
 “Inclusion criteria” for the performance measure of acute-care hospital admissions was defined as “clients enrolled six or more months or clients enrolled less than six months but with two or more acute admissions in the time enrolled thus far, and did not include ‘banked’ clients.”
DAAS defines “banked” clients as CLF clients who “no longer need intensive case management but require CLF’s assistance with the purchase of on-going services and/or money management to remain stable in the community.” That’s it: Once you no longer need intensive “case management” (i.e., a social worker) — whether you’ve been a CLF client for one day or six months — you’re eliminated from this data collection of acute-care hospitalizations simply because you are classified as “banked.” And neither the number of banked clients (who no longer need case management) who are admitted at least once, or more than twice, are reported. Presumably, there may be thousands of still-living CLF banked clients. Aren’t they ever admitted to an acute-care hospital, and ever counted?
 Presumably, CLF clients who die (either in a hospital or in the community) are no longer “banked” clients. But the number of clients who die — either within six months of becoming a CLF client or after six months — also isn’t reported.
Two recent CLF six-month reports are of interest, one dated May 4, 2016 covering July to December 2015 and one dated November 2, 2016 covering January to June 2016.
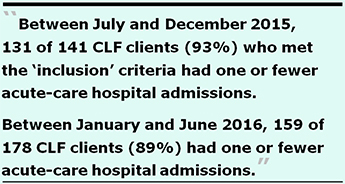
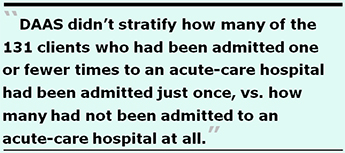
Per a records request to DAAS, between July and December 2015, 131 of 141 CLF clients (93%) who met the “inclusion” criteria had one or fewer acute-care hospital admissions. Of the then-296 CLF clients, 155 (52.4%) did not meet the inclusion criteria, so ostensibly their hospitalization utilization apparently wasn’t reported. DAAS didn’t stratify how many of the 131 clients who had been admitted one or fewer times to an acute-care hospital had been admitted just once, vs. how many had not been admitted to an acute-care hospital at all. Presumably, 10 of the 141 had more than one acute-care hospital admission, although that wasn’t explicitly stated.
Between January and June 2016, 159 of 178 CLF clients (89%) who met the “inclusion” criteria had one or fewer acute-care hospital admissions. Of the then-291 CLF clients, 113 (39%) did not meet the inclusion criteria, so their hospitalization utilization apparently also wasn’t reported. DAAS didn’t stratify how many of the 159 clients who had been admitted one or fewer times to an acute-care hospital had been admitted just once, vs. how many had not been admitted to an acute-care hospital at all. Also presumably, 19 of the 159 had more than one acute-care hospital admission.
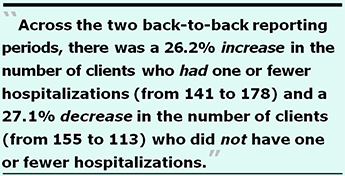 Across the two back-to-back reporting periods, there was a decrease in the percentage of clients who met the inclusion criteria of one or fewer acute-care hospital admissions, from 93% to 89%, but the numbers are deceptive. There was a 26.2% increase in the number of clients who had one or fewer hospitalizations (from 141 to 178), and a 27.1% decrease in the number of clients who did not have one or fewer hospitalizations (from 155 to 113), which suggests they may have had more than one hospitalization or were clients for less than six months.
Given a relatively flat (constant) number of total clients, the number of CLF clients who did not meet the inclusion criteria of being a client six months or more with one or fewer acute-care hospital admissions dropped from 155 (52%) to 113 (39%), perhaps suggesting that there was either a) An increase in the number of acute-care hospital admissions more than once, b) There were fewer clients enrolled longer than six months, or c) There were more “banked” clients. The decrease in the number of clients who did not meet the inclusion criteria was not addressed or explained. Shouldn’t the percentage of CLF clients who did meet the inclusion criteria of one or fewer admissions and enrolled as a client longer than six months be going up, not down?
 Across those two reporting periods, the 29 CLF clients who met the inclusion criteria and who may have been admitted more than twice are of concern, in part because DAAS doesn’t report on how many were admitted to an acute-care hospital twice or more. Nor does DAAS report on how many CLF clients were admitted just once to an acute-care hospital, versus how many of the CLF clients were not admitted to an acute-care hospital at all. The data is relatively loosey-goosey.
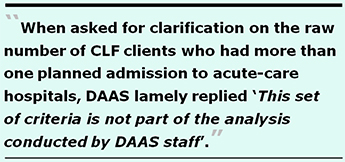
Because the “inclusion criteria” is rather narrowly defined and somewhat arbitrary, the meaning of the data is further obscured. For both reporting periods, when asked for clarification on the raw number of CLF clients who had more than one unplanned admission to acute-care hospitals, DAAS lamely replied “This set of criteria is not part of the analysis conducted by DAAS staff.” Shouldn’t DAAS and DPH be collecting and reporting data to the Board of Supervisors on the number of CLF clients admitted twice or more, or not at all, to acute-care hospitals?
For that matter, data wasn’t presented on the number of hospitalizations of CLF clients enrolled for less than six months. How many of those enrolled in the CLF for less than six months also had at least one unplanned acute-care hospitalization?
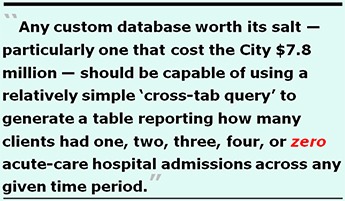 Any custom database worth its salt — particularly one that cost the City $7.8 million to develop and maintain for over a decade like the SFGetCare database — should be capable of using a relatively simple “cross-tab query” to generate a table reporting how many clients had one, two, three, four, or zero acute-care hospital admissions across any given time period, regardless of whether they were CLF clients for less than, or greater than, six months.
That data is probably available at the fingertips of Shireen McSpadden, Director of DAAS and Barbara Garcia, Director of Public Health, and should be reported to the Board of Supervisors and members of the public. It’s more likely that DAAS and DPH just don’t want to report and publish the data.
All of these oddities with the data reporting would have troubled Sister Miriam.
Budget and Legislative Analyst (BLA) Report on Senior Services
 In September 2015 Supervisor Aaron Peskin introduced Motion 15-135 directing the BLA to conduct a performance audit of services to seniors; his motion passed. It took the BLA until July 2016 to conduct and publish results of this performance audit. Unfortunately, the Board of Supervisors Budget and Finance Sub-Committee took another eight months after the BLA’s report was published before it scheduled and held a hearing on the report on March 9, 2017.
It’s shameful that it took fully 19 months between Peskin’s motion being passed and the Sub-Committee’s hearing — as if there were no sense of urgency even while almost two years have passed! The sub-committee is currently comprised of Supervisors Malia Cohen, Norman Yee, and Katy Tang.
Right out of the gate, the July 2016 BLA report noted on page “i” in the first section of the Executive Summary that a “Service Gap Analysis” had not been performed, despite a review by the City Controller more than a decade earlier in 2005.
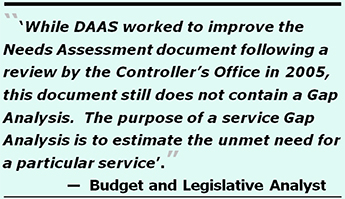
“The Department of Aging and Adult Services (DAAS) is required to complete a Needs Assessment and Area Plan every four years in compliance with federal and state requirements. While DAAS worked to improve the Needs Assessment document following a review by the Controller’s Office in 2005, this document still does not contain a Gap Analysis. The purpose of a service Gap Analysis is to estimate the unmet need for a particular service, which is the gap between the number of individuals currently receiving services, and the total population that might benefit from, or be eligible for, a particular service. Without a Gap Analysis, the department lacks critical information when making decisions as to where it might best allocate existing service resources and what additional level of resources to request.”
 The BLA was crystal clear: Without a gap analysis in a senior services needs assessment, the City lacks information critically necessary for decision-making.
The BLA report also appears to be factually wrong when it claimed on page iii “The City has conducted extensive strategic planning for senior services” since adopting a model designed to divert patients from “institutions into the community.”
One sign this claim appears to be incorrect is the sheer number of patients dumped out-of-county, because they are clearly not being “integrated” into community living in San Francisco where they can “age-in-place” at home! Another sign this claim is false is that while the Controller’s analysis in 2005 noted DAAS needed to improve its Needs Assessment document, here we are a dozen years later and DAAS’ (and possibly the Department of Public Health’s) Needs Assessment instruments have still not incorporated a full gap analysis to measure unmet needs, including unmet skilled nursing care needs.
How can the City claim extensive strategic planning has been conducted, in the absence of a senior services gap analysis?
 The BLA can’t have it both ways: It can’t claim “extensive strategic planning” has been conducted, given that the gap analysis hasn’t been performed for a dozen years — dating all the way back to the creation of Mayor Newsom’s LTCCC. How the Community Living Fund was created in 2007 in the absence of a gap analysis is a mystery. It’s even more of a mystery how the new “Dignity Fund” was created in 2016 by voters, also in the absence of a gap analysis.
Remarkably, page 18 of the BLA’s performance audit includes Table 1.2, Gap Ratings for Senior Service Areas (Rapid City, SD) as an example. The Rapid City gap analysis included as one of the 17 categories of services seniors are interested in, a category specifically regarding expressed needs for assisted living and skilled nursing facility care.
 Between DAAS and DPH why can’t they measure the gap between elderly and disabled San Franciscan’s preferences for assisted living and skilled nursing facilities in San Francisco and the unmet need to help keep them in-county? If Rapid City, SD can collect data on skilled nursing facility needs and preferences as part of its gap analysis, why can’t San Francisco measure that gap here, too?
It’s time to stop the lie that elderly and disabled San Franciscans are being “integrated” into community living in San Francisco with appropriate “services and supports,” given ample evidence of a significant number of out-of-county discharges. And because DAAS and the LTCCC have failed to perform a gap analysis for a dozen years since shortly after the LTCCC was initially created, there’s no evidence that the services and supports being provided are actually helping to integrate the elderly and disabled into San Francisco communities.
The Misguided “Dignity Fund”
The Community Living Fund was the precursor to San Francisco’s new “Dignity Fund.” It’s not clear at this point whether the CLF will continue to be funded to supplement the Dignity Fund, or if the Dignity Fund will supplant the CLF entirely.
 The most serious flaw in the “Dignity Fund” passed by voters as Proposition I in November 2016 is it expressly prohibits expending funds to care for the elderly in skilled nursing facilities, or any other medical facilities such as post-acute care facilities. The Dignity Fund does not intend to measure unmet needs for either post-acute care or SNF facilities.
Another major flaw in the Dignity Fund is that categories of the Fund’s spending by planned use was not identified prior to placing this measure on the ballot by conducting a “community needs assessment” beforehand, which wasn’t performed. How could this Fund have been justified, in the absence of conducting a needs assessment complete with a gap analysis?
By FY 2026–2027, the Dignity Fund will have been awarded a cumulative $575 million, but nobody knows what it will be used for because DAAS intends to only begin conducting a Community Needs Assessment starting in late FY 2017–2018, perhaps the Spring of 2018. Isn’t this the cart before the horse?
Key deliverables described in a PowerPoint presentation about the Dignity Fund presented to the Board of Supervisors Budget and Finance Subcommittee by DAAS on April 9 is troubling. The presentation shows on page 9 that in FY 2017–2018 DAAS will conduct a community needs assessment, and will then develop a “Service and Allocation Plan” (SAP — another unfortunate acronym) the following year in Fiscal Year 2018–2019 (starting on July 1, 2018). DAAS will ostensibly start rolling out the SAP (and funding) in Fiscal Year 2019–2020. The illustration clearly shows the SAP will be implemented starting July 2019.
 If any funding from the Dignity Fund is awarded to service providers or clients before July 2019, that portends the funds may be used before development of the SAP is completed. Will we really have to wait until July 1, 2019 before any of the Dignity Fund services reach the intended clients?
Tellingly, the ballot measure appears to have been submitted to voters in the absence of having performed a “community needs assessment” to identify whether $38 million in the first year, $44 million in the second year, or $71 million in FY 2026–2027 are necessary. Instead, after receiving the first $38 million in the current fiscal year and $44 million next fiscal year, and only after it has already received fully $82 million for as-yet unidentified “needs” will DAAS then get around to conducting a needs assessment. And it’s unknown at this point whether DAAS will finally include in that needs assessment a robust gap analysis.
 Given the dismal performance of the Community Living Fund — the precursor to the new Dignity Fund — do San Franciscans really want DAAS overseeing development of Service and Allocation Plans for the Dignity Fund? After all, accountability of the $40.3 million allocated to the Community Living Fund to date hasn’t garnered much of a vote of confidence from CLF clients.
The Board of Supervisors shouldn’t release one penny of the $575 million Dignity Fund until a full Senior Services gap analysis for skilled nursing facility care has been performed.
Lack of Empathy
 The absolute hatred exhibited by the LTCCC, CLF, and Dignity Fund of providing skilled nursing facility care to elderly and disabled people who may actually prefer an institutional setting is symptomatic of a lack of empathy for vulnerable patients’ choices for those who may prefer receiving their care in long-term care, skilled nursing facilities in-county.
What these organizations fail to measure, they can’t accurately assess. Nor can they fix it, particularly without a gap analysis measuring client preferences. This lack of empathy would have also saddened our Torchbearer, Sister Miriam.
That’s why, in part, San Franciscans are in such dire need of a new torchbearer.
Monette-Shaw is a columnist for San Francisco’s Westside Observer newspaper, and a retired San Francisco City employee. He received a James Madison Freedom of Information Award in the “Advocacy” category from the Society of Professional Journalists–Northern California Chapter in 2012. He’s a member of the California First Amendment Coalition (FAC) and the ACLU. He can be contacted at monette-shaw@westsideobserver.com.