 Article
in Press Printer-friendly PDF file
Article
in Press Printer-friendly PDF fileWestside Observer Newspaper
March 2016 at www.WestsideObserver.com
Mayor’s Hiring Spree Unsustainable
Mayor’s Hiring Binge vs. Retiree Pensions
 Article
in Press Printer-friendly PDF file
Westside Observer Newspaper
March 2016 at www.WestsideObserver.com
Mayor’s
Hiring Spree Unsustainable
Mayor’s
Hiring Binge vs. Retiree Pensions
by Patrick Monette-Shaw
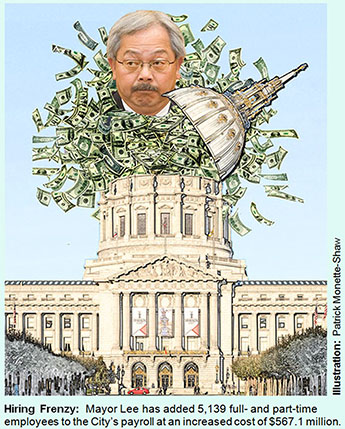
Once again, retired City employees are wrongly being blamed for Mayor Ed Lee’s looming budget deficit. The Mayor has quietly been on a hiring binge since taking office in January 2011, but seeks help from his media shills to obscure his budget failures by blaming City retirees.
This is completely twisted logic. Yet again, San Francisco Chronicle gossip columnists Matier and Ross have rushed to Lee’s rescue using yet more Chronicle spin control.
On December 7, 2015, Matier and Ross reported that “nearly half” of a projected $99 million deficit for Fiscal Year 2016–2017 starting July 1, 2016 “can be chalked up to skyrocketing pension costs.” But Matier and Ross noted that just $42 million is attributable to increased pension costs, which represents only 42.2% — not “nearly half” — of the projected deficit. While Matier and Ross railed against retirees, they neglected a basic duty of journalists to report facts fully, since they didn’t bother reporting other causes of the remaining $57 million projected deficit, perhaps hoping readers wouldn’t notice that something else may be out of whack contributing to the Mayor’s projected budget deficit.
While Matier and Ross noted the $99 million deficit for FY 16–17, they failed to report that according to the City Controller, Mayor Lee appears to be facing a whopping $538.4 million deficit in FY 19–20, just four-and-a-half years from now, that clearly isn’t solely attributable to increased pension costs.
 And of course, Matier
and Ross mentioned not one word of an October 20, 2015 Chronicle
article that reported Mayor Lee’s so-called
“Twitter Tax Break” let mid-market technology firms
avoid paying $34 million in taxes during FY 2013–2014, which
was $30 million more than the $4 million Twitter Tax Break in
FY 2012–2013, and which more than likely has grown even higher
in FY 2014–2015 and the current FY 2015–2016.
Matier and Ross appear to prefer bashing City retirees, rather than bashing the tech companies cashing in on the lucrative Twitter Tax break that helps billionaires like Ron Conway, the Mayor’s chief campaign fundraising source.
Fast forward a month to January 5, when the San Francisco Examiner reported Mayor Lee has requested that City departments cut spending by 1.5% to cover the $100 million deficit for FY 2016–2017, and cut an additional 1.5% in their FY 2017–2018 budgets. The Mayor’s budget instructions claim that the two-year 3% budget cuts are necessary and are “roughly equivalent to the citywide impact of the increased pension costs in each of the next two fiscal years.”
 For their part, Matier
and Ross reported in December that pension payouts over the next
four fiscal years (starting July 1, 2016) will increase by $113
million. It is thought $42 million of that can be attributed to
increased pension costs in FY 2016–2017; the remaining $71
million increase reportedly occurs in the following three fiscal
years between FY 17–18 and FY 19–20. Matier and Ross
confounded the causes of the $113 million, implying that it was
caused by retirees winning a lawsuit involving COLA payments,
that retirees are living longer, and lower-than-expected pension
fund investment returns.
Unfortunately, Matier and Ross may have misread a City Controller’s report also dated December 7, that appears to indicate that of the $113 million pension increase during the next four fiscal years, only $35.9 million may be attributable to the three factors (decreased mortality, decreased investment returns, and COLA payments), and the remaining $77.1 million may involve increased pension costs that had already been identified previously.
 For its part, the
San Francisco Examiner rightly noted that there are other
factors driving the budget deficit, including voter-adopted baselines
and set-asides, along with projected increases in citywide operating
costs, and other factors, which appeared to have been of no interest
to Matier and Ross as they rushed to bash City retirees.
And stupidly, Matier and Ross turned a blind eye to the Mayor’s hiring binge, and baseline and set-aside budget increases.
Mayor’s Hell-Bent Hiring Binge
Mayor Lee initially took office at the half-way point during FY 2010–2011 when his tenure began on January 11, 2011. During the five years he has held office, he added 5,386 new of City employees across 41 City departments, according to the City Controller’s fiscal year payroll databases, but offset that by eliminating 246 other City jobs across 11 other City departments. Of the 246 jobs eliminated, it saved Lee’s payroll-only budget just $4.8 million in just three City departments, at the same time that of the 246 jobs eliminated in the 11 affected City departments saw total pay increase by $48.7 million, for a net increase of $43 million, even among City departments who lost headcount.
The net change under Lee’s administration is he has added 5,139 full- and part-time employees to the City’s payroll at an increased cost of $567.1 million — slightly over a half-billion dollars — during just four-and-a-half short years. And that’s not including fringe benefits and increased pension costs for the additional 5,139 City employees.
 As Table 1 below illustrates, the 5,139 additional
City employees represents a 15.1% increase in headcount and a
22.2% increase to the amount of the payroll during Lee’s
tenure. What changed in City government requiring so many more
City employees?
What more will Lee do to increase City Hall patronage hiring during his final four-year term, and at what cost?
We don’t yet know how many more City employees Lee plans to hire in the current fiscal year, how many additional employees he may have already hired between July 1 and December 31, 2015, or how many he plans to hire between January 1 and June 30, 2016. But the number of new hires will likely go up, not down, despite his looming deficits. And of course the additional salaries in the payroll will come with added increases to pension benefits and fringe benefits.
Fattening the City Budget and Payroll
 When Ed Lee became
mayor, the City’s total budget as adopted was $6.56 billion.
Within just four-and-a-half years, by FY 14–15 the City’s
total budget skyrocketed to $8.58 billion, a net
change of $2.2 billion — a staggering 30.8% increase.
Hidden away in the $2.2 billion total City budget increase was proof Lee has been on a hiring binge since taking office: The increase of $567.1 million in payroll costs, alone, represented almost 25% of the total City budget increase, which may prove to be unsustainable when the economic bubble bursts.
And while Matier and Ross whined about the $99 million budget deficit the Mayor is facing for FY 16–17, the two men made no mention that the City Controller appears to be projecting a whopping $538.4 million shortfall (deficit) by FY 19–20, driven in significant measure by the Mayor’s hiring spree in adding 5,139 employees (and counting) to the City’s payroll. The “bubble” may already be bursting.
Table 1: Summary of Mayor Lee’s Overall Hiring Binge

 It’s clear the
Mayor has increased staffing by 15.1% and the City’s overall
payroll by 22.7%, which Matier and Ross all but ignore when it
comes to increasing City employer contributions to the City’s
pension fund.
The attached report details specifics of increased employee headcounts in each of the City’s 52 departments
The City likes to claim a lower number of total City employees so as not to frighten the horses (otherwise known as taxpayers), but does so by combining multiple part-time employees into so-called Full-Time Equivalents (FTE’s). For example, of the 33,983 City employees in FY 10–11, aggregating part-time employees results in an approximation of just 26,670 “FTE’s.”
Of the 39,122 City employees reported in the City Controller’s payroll database for FY 14–15 for the period ending June 30, 2015, that translates into the mythical approximation of just 30,414 FTE’s, which, of course, is pure nonsense given that there were nearly 40,000 (39,122) warm bodies on the City’s payroll.
Unfortunately, it is not possible to easily research or calculate associated increases in fringe benefits included in Mayor Lee’s $2.2 billion City budget increase during this five fiscal-year period, because fringe benefit rates are tied to various union contracts and labor agreements, and specific job classification codes represented by each union.
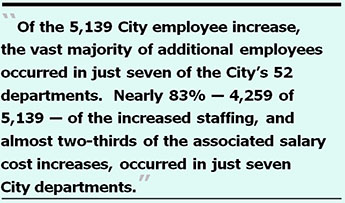
Of the 5,139 City employee increase during Lee’s tenure, the vast majority of additional employees occurred in just seven of the City’s 52 departments. Nearly 83% — 4,259 of 5,139 — of the increased staffing, and almost two-thirds of the associated salary cost increases, occurred in just seven City departments as shown below in Table 2.
Table 2: Seven Largest City Departments as Beneficiaries of Mayor Lee’s Hiring Binge

 A quick review of
each of these seven City departments is instructive: (Note:
Each of the following detailed reports compare percent changes
within a given City department, rather than percent
changes Citywide.)
Growth at the Department of Public Health
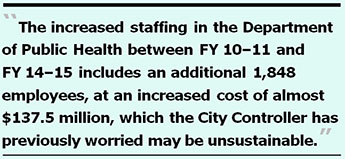
The attached report details job classification code changes between FY 10–11 and FY 14–15 for the Department of Public Health. Some observations include:
Growth at the Human Services Agency
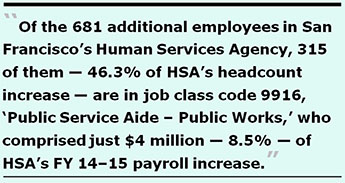 The attached report details job classification code changes
between FY 10–11 and FY 14–15 for San Francisco’s
Human Services Agency.
Growth at the Fire Department
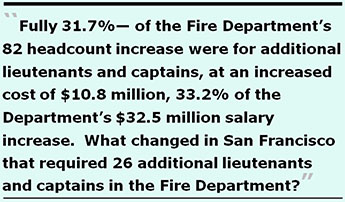 The attached report details job classification code changes
between FY 10–11 and FY 14–15 for the Department of
Fire Department.
Growth at the Municipal Transportation Agency
 The attached report details job classification code changes
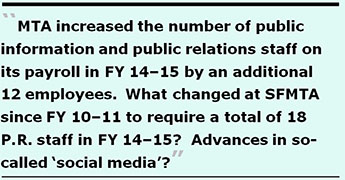
between FY 10–11 and FY 14–15 for MTA. SFMTA’s
budget increase of $75.65 million between FY 10–11 and FY
14–15 is worrisome.
 Between FY 10–11
and FY 14–15, the 9163 Transit Operators increased by just
by 329 — 13.8% — from 2,379 in FY 10–11 to 2,708
in FY 14–15.
Between FY 10–11
and FY 14–15, the 9163 Transit Operators increased by just
by 329 — 13.8% — from 2,379 in FY 10–11 to 2,708
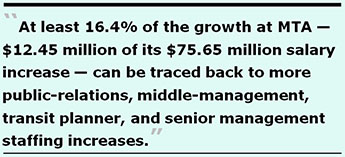
in FY 14–15.At least 16.4% of the growth at MTA — $12.45 million of its $75.65 million salary increase — between FY 10–11 and FY 14–15 can be traced back to more public-relations, middle-management, transit planner, and senior management staffing increases, which obviously don’t help Muni reach its on-time performance any better.
Growth at the Office of the Mayor
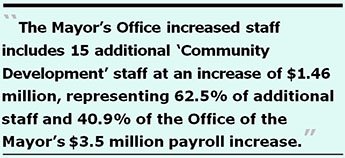 The attached report details job classification code changes
between FY 10–11 and FY 14–15 for various branches within
the Mayor’s office. While the Office of the Mayor wasn’t
actually among the City’s departments seeing major staffing
increases across this period, increased staffing in Ed Lee’s
various sub-offices is informative.
Growth at the Police Department
 The attached report details job classification code changes
between FY 10–11 and FY 14–15 in the Police Department.
 Growth at the Recreation and Parks Department
The attached report details job classification code changes between FY 10–11 and FY 14–15 for Rec and Parks.
 Between FY 10–11
and FY 14–15, the 9910 Public Service Aides increased at
Rec and Parks by 147 — a 65.9% increase — from 223
in FY 10–11 to 370 in FY 14–15. It isn’t known
why Rec and Park needed so many more Public Service Aides.
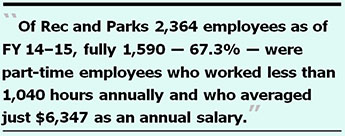 Of Rec and Parks
2,364 employees as of FY 14–15, fully 1,590 — 67.3%
— are part-time employees who work less than 1,040 hours
annually and who averaged just $6,347 as an annual salary. This
is clearly no accident, as RPD General Manager Phil Ginsburg
is a labor lawyer, and he knows all too well that part-time employees
do not receive either living wages, or earn fringe benefits.
Ginsburg knows exactly what he is doing with RPD’s salary
budget.
Screwing Part-Time Employees
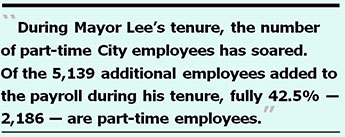
During Mayor Lee’s tenure, the number of part-time City employees has soared. Of the 5,139 additional employees added to the payroll during his tenure, fully 42.5% of them — 2,186 — are part-time employees. It’s a deliberate cost-savings maneuver on the Mayor’s part, including both salary savings and associated fringe benefit savings.
Table 3 below shows that 2,186 — 42.5% — of the Mayor’s additional 5,139 hires to the payroll are part-time employees who worked less than 1,040 hours in FY 14–15.
Table 3: The Surge in Part-Time Employees During Mayor Lee’s Tenure

 The 9,692 part-time
employees Citywide as of FY 14–15 represent almost 25% of
the all City employees; their average salaries were just over
$16,000 annually.
By hiring more and more part-time employees, Ed Lee is shrewdly avoiding paying living wages and fringe benefits to City employees, screwing them in the process.
Table 4 below illustrates that of the 5,139 additional employees during Mayor Lee’s tenure, fully 3,972 — 77.3% — were hired in just four City departments. Of those 3,972, fully 2,057 — 51.8% — are part-time employees working less than 1,040 hours annually, and their average annual salaries range from a paltry $1,421 to just $2,563 for an entire year!
Table 4: Major Increases to Departmental Part-Time Employees — FY 10–11 and FY 14–15

 Table 4 also illustrates
that of the total 20,520 employees in these four City departments
almost one-third of them are part-time employees who worked less
than 1,040 hours in FY 14–15 and averaged very low annual
salaries.
Table 5 below illustrates that fully 863 — 45.3% — of the 1,907 additional employees in a select handful of City job classification codes between FY 10–11 and FY 14–15 were part-time employees. Of the 5,985 employees remaining in these 6 to 10 job classification codes in FY 14–15, fully 3,377 — 56.4 % — are part-time employees who earn, for the most part, paltry annual part-time salaries.
Table 5: Job Classification Code-Specific Increases to Part-Time Employees — FY 10–11 and FY 14–15
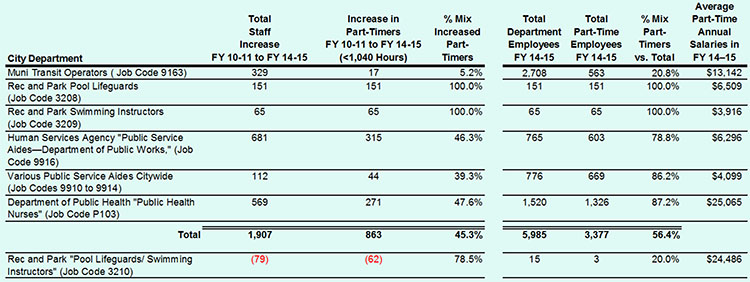
 Table 5 also illustrates
that job classification 3210 that had combined Pool Lifeguards
and Swimming Instructors in a single job classification code was
split into two separate job classification codes (3208 and 3209),
and that fully 100% of the 3208 and 3209 employees at the Recreation
and Parks Department are all now part-time employees, making substantially
less in part-time salaries than the 15 remaining employees in
job classification code 3210.
Fringe Benefits Savings
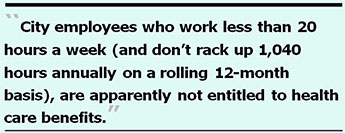
The trend toward hiring ever-increasing part-time employees citywide is significant, in part, because City employees who work less than 20 hours a week (and don’t rack up 1,040 hours annually on a rolling 12-month basis), are apparently not entitled to health care benefits, whether they are classified as permanent civil service (PCS), permanent exempt (PEX), temporary provisional (TPV), or temporary exempt (TEX) employees. And an unknown number of so called “as-needed, intermittent, or seasonal employees” receive no health care benefits at all — whether or not they reach the 1,040-hour threshold — unless they are a TEX employee after reaching the 1,040 hours in a rolling 12-month basis.
 How part-time City
employees do not
receive health benefits until working 1,040 hours seems to fly
in the face of San Francisco’s Health Care Security Ordinance,
which requires private-sector employers to provide healthcare
benefits, irrespective of the number of hours worked. Why is there
a carve-out allowing the City to not pay healthcare benefits to
its 9,692 part-time employees working less than 1,040 hours annually?
The answer, obviously, is to save the City a lot of money in fringe
benefit costs!
Similarly, the City apparently may not contribute toward retirement benefits for employees working less than 20 hours a week, unless and until they work 1,040 hours in a rolling 12-month period, with the exception of Permanent Civil Service (PCS) employees who do receive the City contribution to retirement, while PEX, TPV, and TEX employees do not. It is not yet known, however, whether the PEX, TPV, and TEX employees are required to pay the employee contribution to the retirement system, even while probably not earning the employer-contributed share towards a pension.
Other Factors Driving Mayor’s Budget Deficit
 While Matier and
Ross whined about the $113 million increase in pension costs over
the next four fiscal years (FY 16–17 through FY 19–20)
that were largely of the City’s own fault, the pair of gossips
raised not one word about the combined increase to the General
Fund during the same four-year period in which there will be a
minimum increase of $536.9 million for various baseline and set-aside
programs and other citywide operating increases, including a staggering
$118 million increase to support the City’s so-called “non-profit
partners,” and a whopping $58.1 million increase in servicing
the City’s debt load.
The data presented in Table 6 below is taken from a report the City Controller released on December 7, 2015, titled “Five-Year Financial Plan Update for General Fund Supported Operations.”
It is thought the City Controller’s updated report only includes increases in changes to the Five-Year Plan since it was last calculated and presented a year ago, but probably not the entire dollar amount for each of the programs listed.
I say this, in part, because the line item for the Housing Trust Fund baseline reports there will be a $2.8 million increase to the Housing Trust Fund in each of the next four fiscal years, but doesn’t report that voters in November 2012 approved starting the fund with an initial allocation of $20 million and adding $2.8 million each new fiscal year to the allocation made in the prior fiscal year.
For instance, the Housing Trust Fund’s (HTF) initial $20 million General Fund set-aside occurred in FY 13–14. Two fiscal years later, the HTF set-aside had already reached $25.6 million by our current FY 15–16. In reality, allocations to the HTF will increase to $28.4 million in FY 16–17, $31.2 million in FY 17–18, $34.0 million in FY 18–19, and $36.8 million in FY 19–20, illustrating data in the Controller’s December 2015 report probably shows new changes to projections previously issued, not the actual allocations each baseline program will eventually be awarded.
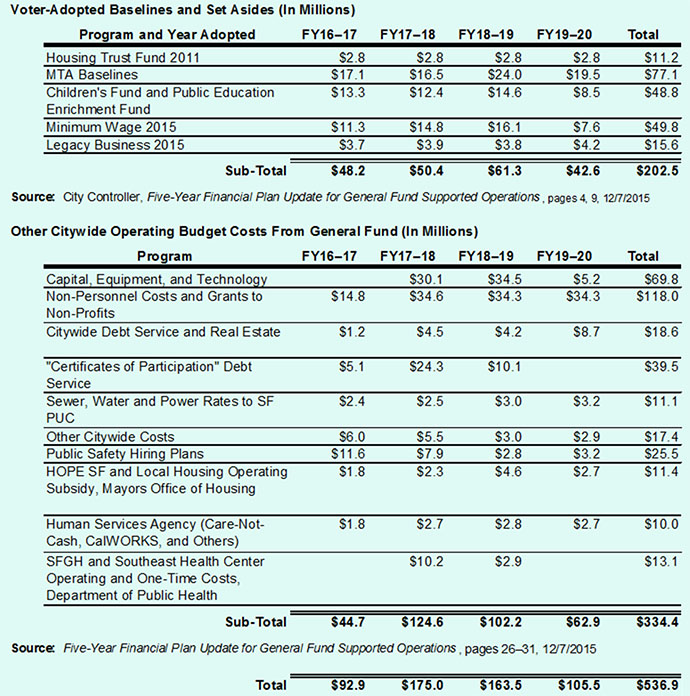
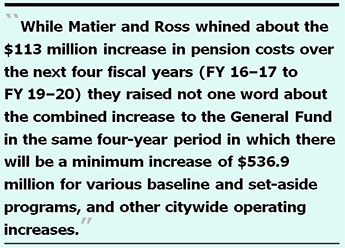 Table 6 below shows that the Controller is
now projecting additional increases to previous projections for
various voter-adopted baselines and set-asides of $202.5 million,
including a $77.1 million increase to MTA baselines and minimum
wages and $49.8 million to the minimum wage baseline in the four
fiscal years between FY 16–17 and FY 19–20.
Table 6 also shows a whopping $334.4 million to a variety of other citywide operating budget costs over the same four Fiscal Years, including $118 million increase for non-personnel costs and grants to the City’s non-profit “partners,” and an additional $58.1 million to cover increases to service various forms of debt funded by the General Fund.
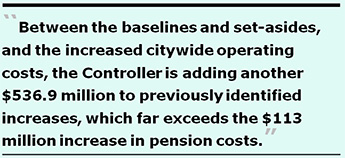
Between the baselines and set-asides, and the increased citywide operating costs, the Controller is adding another $536.9 million to previously identified increases, which far exceeds the $113 million increase in pension costs.
Table 6: Looming Increases to General Fund Mandates
 Why aren’t Matier
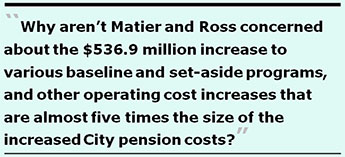
and Ross at all concerned about servicing the City’s $18.1
million debt load, another $39.5 million increase to service debt
on the “Certificates of Participation,” or the $202.5
million in voter-adopted baseline and set-aside increases, or
the $334.4 million increase to other operating costs?
Are the pair cherry-picking what they’re going to whine about? After all, the $536.9 million increase to various baseline and set-aside increases, and other operating cost increases, are almost five times the size of the increased City pension costs.
The $536.9 million increase only includes the major programs in baselines and set-asides. An additional $15.3 million for increases to smaller programs may also be involved.
Readers are reminded that Table 6 probably only shows additional increases to these programs since previous projections issued a year ago, not the full allocations that may eventually be made.
 Rise in the City’s $100,000+ Salary
“Fat Cat” Club
Mayor Lee has clearly been on a hiring binge for City employees earning over $100,000 annually since assuming office.
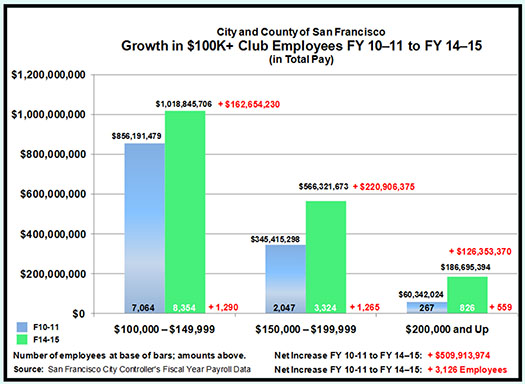
Figure 1 below has been updated since I presented it in my October 2015 article, in part because I noted a discrepancy in the City Controller’s FY 10–11 payroll database the Controller’s Office just recently acknowledged it had incorrectly provided to me had included payroll data for Superior Court employees who are not City employees; the City just administers issuing paychecks to Court employees.
Figure 1: The Growth in the Over “100K Club” Keeps Climbing — FY 10–11 to FY 14–15
 Interestingly, Figure
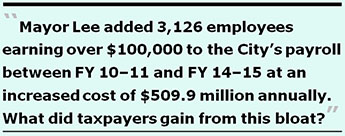
1 illustrates that Mayor Lee added 3,126 employees earning over
$100,000 to the City’s payroll between FY 10–11 and
FY 14–15 at an increased cost of $509.9 million annually.
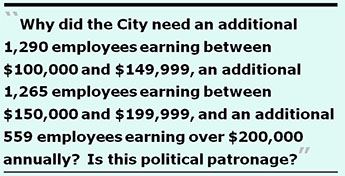
Why did the City need an additional 1,290 employees earning between $100,000 and $149,999 at an increased cost of $162.7 million? Why did the City need an additional 1,265 employees earning between $150,000 and $199,999 at an increased cost of $220.9 million? For that matter, why did the City need an additional 559 employees earning over $200,000 annually at an increased cost of $126.4 million? What did taxpayers gain from this bloat?
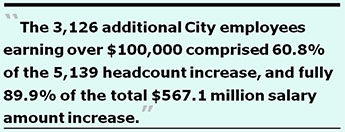
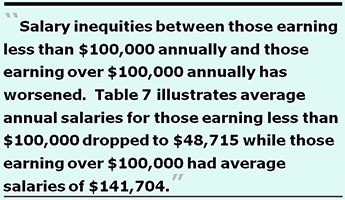
More troubling Table 7 below illustrates salary inequities that have dramatically worsened under Mayor Lee. The 3,126 additional City employees earning over $100,000 comprised 60.8% of the headcount increase, and fully 89.9% of the total $567.1 million salary amount increase. By contrast, the additional 2,013 employees added to the payroll accounted for almost 40% of the 5,139 employee increase, but were awarded just 10.1% of the $567.1 million salary amount increase. How’s that for the “one-percent-ers” (1%) getting richer while the 99% of us get poorer?
Table 7: Salary Inequities: FY 10–11 to FY 14–15

 Salary inequities
between those earning less than $100,000 annually and those earning
over $100,000 annually has worsened. Table 7 illustrates there
has been a 33.3% increase in the number of employees earning over
$100,000 between FY 10–11 and FY 14–15, along with a
40.4% increase to the City payroll.
The average annual salary for those earning less than $100,000 dropped to $48,715 in FY 14–15 while those earning over $100,000 had average salaries of almost $100,000 more, at $141,704. Can Mayor Lee spell i-n-e-q-u-i-t-y?
Table 7 also shows the inequities for those earning less than $50,000 annually. There was a 16.9% increase — 1,754 — of such employees between FY 10–11 and FY 14–15, but their average salaries plunged by $2,425 to just $17,336, a whopping 12.3% loss in average salaries for those making less than $50,000, even while the 33.3% increase in those earning over $100,000 saw their average salaries increase by $5.3%.
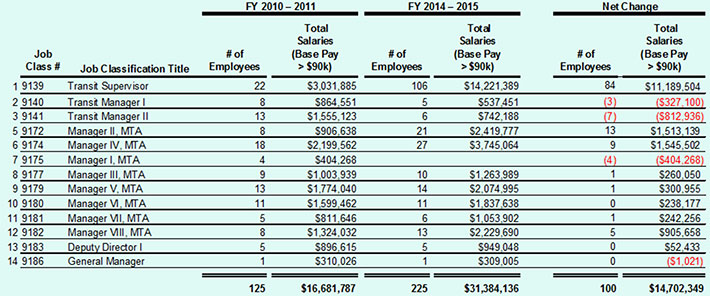
 Table
8 and Table 9 below show the growth in City managers
citywide and additional growth in Muni-specific managers between
FY 10–11 and FY 14–15 who earned over $90,000 in base “Regular Pay.”
[Note: The three “Total Salaries” columns show
their combined “Total Pay,” which includes regular base
pay, overtime, and various “Other Pay.”]
Table 8: Bloat in Citywide Senior Managers Earning Over $90,000 in Total Pay: FY 10–11 to FY 14–15
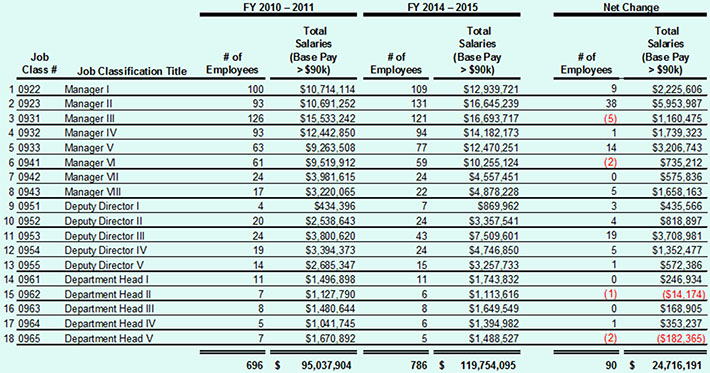
 Between the citywide
managers in Table 8 above and the Muni-specific managers and transit
supervisors, in Table 9 on the next page, the City added an additional
190 managers, at an increased cost of $39.4 million — fully
7% of Mayor Lee’s additional $567.1 million increase to the
City’s budget. One reasonable question is: How have these
additional 190 managers improved operations of City departments?
Another reasonable question is whether the additional almost $40
million cost is justified. Does our City operate and function
any better with this added bloat? Or is this just more political
patronage and cronyism for employees who can comfortably afford
to make political campaign contributions to the Mayor?
Table 9: Bloat in Senior MUNI Managers Earning Over $90,000 in Total Pay: FY 10–11 to FY 14–15
 City’s Pension Contribution Share
Inextricably Linked to Total Payroll
It is indisputable the City has made higher pension contributions between FY 10–11 and FY 14–15. The San Francisco Employees’ Retirement System (SFERS) just released its annual report for FY 2014–2015, which shows in FY 10–11 the City’s employer share of retirement contributions totaled $308.8 million and rose to $592.6 million in FY 14–15, for a net increase of $283 million across the four fiscal years.
The $283 million net increase in employer pension contributions more than likely had nothing to do with the three factors Matier and Ross whined about (increased life expectancy of retirees, the supplemental COLA payment, or lower investment returns), since the lower investment returns did not occur until FY 14–15, the supplemental COLA lawsuit was only resolved towards the end of FY 14–15, and City retirees had been having a lower mortality rate for a number of years that was simply not discovered and reported by SFERS’ actuarial consultants.
 Instead, dollars
to donuts suggest the $283 million increase to the City’s
required employer share of pension contributions is more than
likely attributable to the hiring binge Ed Lee has been on since
taking office, which increased the City’s overall payroll
by $567 million during his tenure, resulting in the increased
total dollar amount of City contributions towards pension contributions.
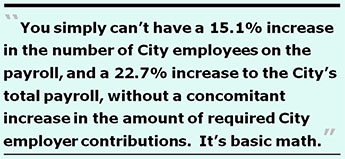
You simply can’t have a 15.1% increase in the number of City employees on the payroll, and a 22.7% increase to the City’s total payroll, without a concomitant increase in the amount of required City employer contributions. This isn’t rocket science, it’s basic math, apparently lost on Matier and Ross.
Since the City’s share of employer contributions is based on a percentage of payroll, it’s obvious that if the percentage of employer contribution remains constant (or even increases), but is applied to a significantly larger payroll (say a payroll that has increased by $567 million), the total employer contribution is going to increase simply because the size of the payroll has increased. This has nothing to do with actuarial estimates of mortality vs. longevity, age at the time of hire, and length of time being a City employee.
As a partially hypothetical example, if the employer contribution rate is 10% and is applied to a year when San Francisco’s payroll was $2.5 billion (San Francisco’s actual payroll in FY 2010–2011), that suggests the City was on the hook to make $250.1 million in pension contributions as the employer’s share. But when San Francisco’s actual payroll jumped to $3.1 billion in FY 2014–2015, when the same hypothetical 10% contribution rate is applied, the City may then have been on the hook to make $306.9 million as the employer’s pension contribution share, for a net increase of $56.7 million extra as the City’s share. [Note: The contribution rate in this example is hypothetical; payroll amounts are not.]
 You would think
this basic math would have been patently obvious to Matier and
Ross. We just hope that their parent’s public-education or
private-education investments between kindergarten and graduating
from high school wasn’t entirely wasted, and that they were
just being math lazy, ignoring this exercise in basic math.
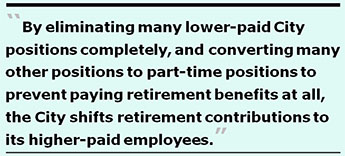
Another piece of this puzzle is that, obviously, the City’s total share of employer contributions is much lower for lower-paid City employees as compared to higher-paid employees. By eliminating many lower-paid City positions completely, and converting many other City positions to part-time positions to prevent having to pay retirement benefits at all, the City seeks to shift retirement contributions to its higher-paid employees, as sure as the Sun rises in the East, or the night follows the day. Another basic premise apparently lost on Matier and Ross.
This is due, in part, because there are many “tiers” within the pension system, each of which were approved by voters who amended the City Charter at the ballot box (like Proposition “C” in November 2011), in part based on which employee labor unions had backed the Charter changes. The Public Safety unions appear to have more “tiers” than non-public safety unions. And when employees who had been contributing at a given rate retire and are replaced by higher- or lower-paid employees, this also affects the City’s employer share of total pension contributions to the pension fund.
 City Looses Lawsuit
In November 2011, the City placed a ballot measure before voters seeking, in part, to strip City employee retirees of supplemental COLA (Cost of Living) benefits, in part based on bad advice from City Attorney Dennis Herrera, who surely must have a team of labor-relations lawyers on his staff who should have known this gambit wasn’t going to pass muster in a court of law. It’s not the first time Herrera’s staff have provided bad advice to the Mayor, and then lost.
After voters wrongly approved restricting COLA payments to
retired City employees, a group called Protect Our Benefits (POB)
sued and eventually won in court, with the City ordered to pay
the withheld two supplemental COLA payments, along with interest
on the delayed payments.
Of approximately 26,000 retired City employees, the City has agreed
so far to restore and pay approximately 17,000 former City employees
the COLA benefit who retired after 1996. The City and the Retirement
Board are still arguing over whether to extend the COLA back payments
to another 7,800 to 8,315 employees who retired prior to 1996.
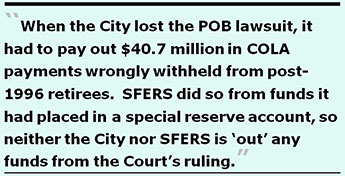 The upshot is
that when the City lost the lawsuit it had to pay out $40.7 million
wrongly withheld from post-1996 retirees, and SFERS did so from
funds set aside during the lawsuit (including for the pre-1996
retirees) that had been placed into some sort of “reserve”
account. So neither the City nor SFERS is “out” any
funds from the Court ruling, since they had already been placed
in some sort of a special reserve account.
This calls into question whether the City Controller’s report claiming there will be a $42.3 million increase to pension benefits in FY 2016–2017 is simply the same $40.7 million already paid to post-1996 retirees, plus another $1.6 million for pre-1996 retirees still under negotiation that may not have been contained in a previous City Controller report, and is simply being double-counted as a “new” expense, when in fact it may have involved funds already held in reserve pending outcome of the lawsuit against the City, that the City may have been hoping to roll over into other pet-cause “uses.”
It wouldn’t be the first time the City, or the City Controller’s Office, has creatively cooked its books and cooked its numbers.
You’d think Matier and Ross would be on to this game by now, rather than racing to bash City retirees. You’d be wrong.
 Indeed, in response
to a records request asking the City Controller’s Office
to itemize the dollar amounts in each of the next four Fiscal
Years for the three factors — increased life expectancy of
retirees, the supplemental COLA payment, or lower investment returns
— the City Controller has continued to stonewall, and hasn’t
provided the same data points for each Fiscal Year as it has for
other baseline set-asides and other operating costs.
In truth, the COLA payments restored by the lawsuit against the City were retroactive supplemental COLA payments for FY 12–13 and FY 13–14 when the pension fund earned excess earnings. There will be no supplemental COLA payments for FY 14–15 and likely not for FY 15–16, given the loss of excess earnings. So any COLA increases in the Controller’s projections are for standard COLA payments, but to a higher number of City employees who have since retired.
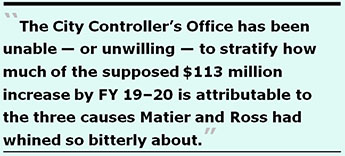
Table 10 illustrates that of the reported $113 million increase in City employer-required contributions by FT 19–20 to the pension fund, the City Controller’s Office has been unable — or unwilling — to stratify how much of the supposed $113 million increase is attributable to the three causes Matier and Ross had whined so bitterly about.
Table 10: City’s “Employer Share” of Pension Contribution Increases — FY 16–17 to FY 19–20 (In Millions)
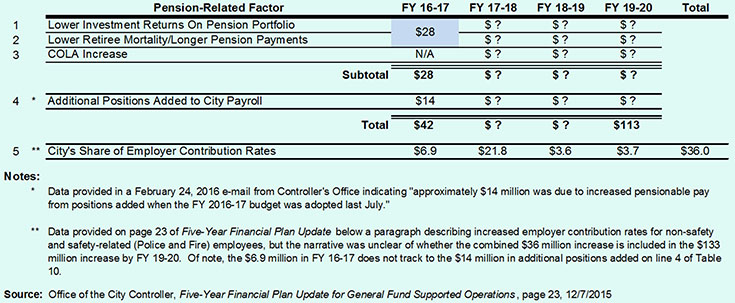
 Row 5 in Table
10 above was inadequately described in the Controller’s report,
and may perhaps reflect increases to the City’s increased
contributions to various “tiers” of police, fire, and
miscellaneous benefit rates, perhaps separate and apart from issues
listed in Rows 1 through 4.
Instead of providing tabular data showing the projected increases for each of the three factors in each of the next four Fiscal Years documenting the claimed $113 million increase in pension-related costs by FY 19–20 as an example in Table 10 above shows, the City’s half-baked response only described (badly, possibly involving contradictions between explanations) the claimed $42 million increase for the first Fiscal Year, FY 16–17. As it will probably turn out, none of the $42 million increase in FY 16–17 may involve COLA increases, which reportedly do not come into play until FY 17–18, shooting one hole in Matier and Ross’ foot.
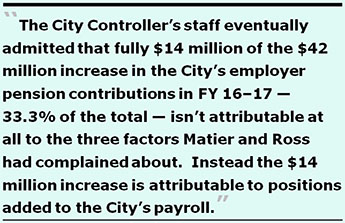
The City Controller’s staff eventually admitted that fully $14 million of the $42 million increase in the City’s employer pension contributions in FY 16–17 — 33.3% of the total — isn’t attributable at all to the three factors Matier and Ross had complained about. Instead, the $14 million portion is attributable to “increased pensionable pay from positions added when the FY 2016-17 budget was adopted in July 2015” … meaning of course, that new employees Mayor Lee added to the budget have, indeed, driven up the employer’s required contribution to the pension system, as expected by basic math possibly lost on Matier and Ross.
Of interest, the City Controller’s Office has so far refused to provide the additional costs of the City’s contributions for Ed Lee’s additional new hires for the following Fiscal Years leading up to FY 19–20, perhaps wanting to obscure the data for political reasons.
I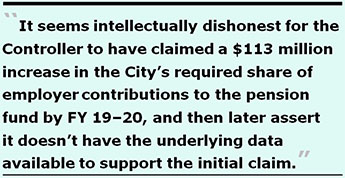 ndeed, when the
City Controller was pushed for further clarification, Controller
Ben Rosenfield’s March 2 e-mail response claimed:
This is hilarious, precisely for the reason that the City Controller’s Office right hand evidently doesn’t know what its left hand is doing.
It seems to me to be intellectually dishonest — or perhaps dishonest from an accounting or auditing basis — for the Office of the Controller to have issued its December 7 “Five-Year Financial Plan Update” claiming a $113 million increase in the City’s required share of employer contributions to the pension fund by FY 19–20, and then claim (as it did) that the Controller’s Office doesn’t have underlying data available or that was previously completed, and that, therefore, the Controller’s Office doesn’t have data responsive to this records request.
How could these trend lines have been created without the underlying data points (in dollars) clearly linked to the trend lines themselves?
 How can the Controller’s
Office have asserted as “fact” a financial projection,
and then claim it has no underlying detailed data to support the
claimed projection?
On February 24, the Controller’s Office claimed that of the $42 million in increased costs in just FY 16–17 alone, fully $14 million (33%) is attributable not to the trend line graphs in Figures 1 on page 3 of this report, and in Figure A-2 on page 24, for the three factors, but to increased positions added after the FY 16–17 budget was first adopted in July 2015 in the two-year budgeting process.
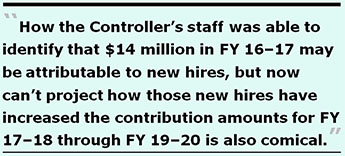
How the Controller’s staff was able to identify that $14 million in FY 16–17 may be attributable to new hires, but now can’t project how those new hires have increased (in dollars) the contribution amounts for FY 17–18 through FY 19–20 also appears to be comical. How could they have found that first-year needle in a haystack, and then not be able to sift through the rest of the haystack?
A reasonable person would think that the Controller’s Office would either rescind the entire December 7 report as unfounded, or at least issue a retraction that it can’t find the data to have justified claiming a $113 million increase by FY 19–20, in the absence of having that data in its hip pocket.
Of note, the City Controller’s report failed to note that San Francisco's Employees’ Retirement System board of directors lowered the employer contribution rate to the Retirement Fund for FY 16–17 down by 1.4% and also lowered active employee contributions down by 1%. The Controller didn’t include those reduced rates and cost savings in his December report, which may significantly reduce the purported $42 million increase in FY 16–17 and the $113 million increase by FY 19–20..
 The Mayor’s Own Estimated Pension
Ed Lee was first hired by the City on April 3, 1989, and has served continuously since then with no breaks in service. He has currently served for 27 years and by the time his tenure is up as Mayor at the end of December 2019, he will have served for 30 years. That earns you a lot in the way of a pension.
As it is, by the time Mayor Lee is termed out, he will have probably earned approximately $2.5 million in salary as the Mayor over an eight-and-a-half year period, given his yet unknown pay raises in FY 2015–2016 to FY 2018–2019 based on his FY 2014–2015 annual salary of $295,848.
Table 11 illustrates that if Mr. Lee were to retire and leave City government when he is termed out of office, he will become the highest-earning retiree among the past six mayors — at a whopping $204,135 estimated annual pension.
Table 11: Historical Trends in Pensions of Former San Francisco Mayors

It may be unlikely, however that Lee will actually retire, because the “Run, Ed, Run” committee that sought to have him appointed as interim Mayor when Gavin Newsom stepped down had recommended a June 2011 ballot measure to amend San Francisco’s City Charter to allow Lee to return to his former City Administrator job immediately after being termed out as mayor. The ballot measure was eventually withdrawn.
But it will not be too surprising if Mayor Lee approaches the Ethics Commission at the end of his term seeking a waiver to get around the one-year post-employment restriction so he can return immediately to his former job.
After all, the San Francisco Examiner reported on March 4, 2011:
Should Mayor Lee approach the Ethics Commission in 2019 seeking a waiver to get around the rule prohibiting the mayor or members of the Board of Supervisors from being appointed to full-time City employment for one year after leaving their elected positions, I’ll attend an Ethics Commission hearing to oppose any such waiver being granted.
 Scapegoating Retirees for Mayor’s
Hiring Binge Is Intellectually Dishonest
In the end, the fact remains that rather than blaming City retirees for living longer and trying to assert that the COLA payments are the main cause of the City’s looming budget deficit, the real culprit may be that Mayor Lee has been on a patronage hiring binge, driving up the amount the City has to contribute as it’s employer share of pension contributions.
Blaming retirees for this is intellectually dishonest.
This is Ed Lee’s own doing, not the fault of City retiree’s
living longer, despite the misinformation Matier and Ross used
to whip up hysteria about increasing pension costs for City retirees,
while simultaneously ignoring massive spikes in baseline set-asides
and other operating cost increases totaling $536.9 million, plus
also ignoring the Mayor’s obvious $567.1 million hiring binge
— that combined, totals over $1.1 billion,
which Matier and Ross didn’t bother even mentioning.
Monette-Shaw is an open-government accountability advocate, a patient advocate, and a member of California’s First Amendment Coalition. He received a James Madison Freedom of Information Award from the Society of Professional Journalists-Northern California Chapter in 2012. He can be contacted at monette-shaw@westsideobserver.